
The Department of Mathematics and Science Education
tiffani c. knight
For this
assignment, I’m going to further examine the different aspects of the equation
y = ax^2 + bx +
c. This time, I am going to do
three things:
1. observe the
graphs when a is varied from [-5, 5] and b & c stay the same.
2. observe the
graph when b is varied from [-5, 5] and a & c stay the same.
3. observe the
graph when c is varied from [-5, 5] and a & b stay the same.
Here we go….oh, I
just kept the constant variables at 1.
When a equals -5,
-4, -3, -2, -1, 0, 1, 2, 3, 4, 5:
![]()
![]()
![]()
![]()
![]()
![]()
![]()
![]()
![]()
![]()
![]()
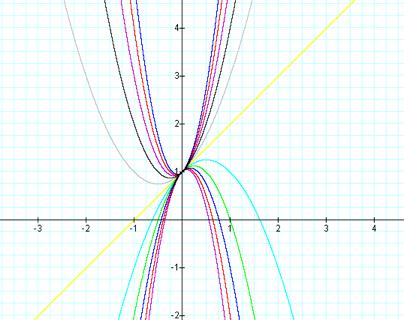
As noted in the previous
assignment, and from the graph above, a determines whether the graphs open
upwards or downwards; up if positive and down if negative. When a is 0, a straight line is
created. Also notice that all
graphs touch at the point (0, 1)
When b equals -5,
-4, -3, -2, -1, 0, 1, 2, 3, 4, 5:
![]()
![]()
![]()
![]()
![]()
![]()
![]()
![]()
![]()
![]()
![]()
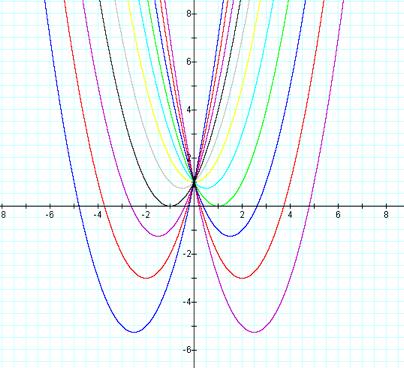
This graph just
confirmed what we know about b. b
determines if the graph will shift left or right on the x axis. Here’s the part that is somewhat
confusing to grasp, especially with students, but it’s just one of those things
you have to remember. The graph
shifts left when b is positive.
The greater the number, the further left it will be. And the graph shifts right when b is
negative. The more negative
(meaning the smaller b gets in terms of negative numbers), the further right it
goes. I say that this is confusing because we usually associate the left
with negative numbers and the right with positive numbers…I guess this is a
special case.
When c equals -5,
-4, -3, -2, -1, 0, 1, 2, 3, 4, 5:
![]()
![]()
![]()
![]()
![]()
![]()
![]()
![]()
![]()
![]()
![]()
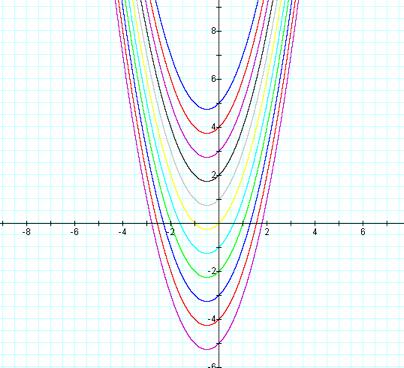
Finally, from this
graph, it appears as though c determines where the parabola will cross the
y-axis.
This would be a
great activity for my students to explore.