
The Department of Mathematics and Science Education
tiffani c. knight
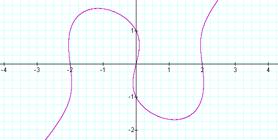
Okay, first let’s look at the
graph of ![]()
Next, we’re going
to replace the 4 from the equation above with 5, 3, 2, 1.1, 1, 0.9, and
-3. ( I am including the original
equation to observe the relationship between the equations to the original
one). Let’s observe:
![]()
![]()
![]()
![]()
![]()
![]()
![]()
![]()
It appears that as
the number replaced gets smaller, the curve/hump of the equation gets smaller
and starts to form an oval shape…elliptical?
And when the
actual number is replaced with a negative, the oval becomes narrower and is
vertical, not sideways. Hmmmm.
And when replaced
with 1, that graph creates a straight line through (0,0) and it’s the only one
that does that.
The interesting
thing about them all is that they intersect in three places (0,1), (0,-1), and
the origin (0,0).
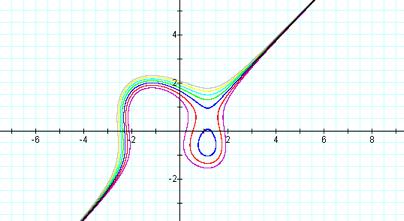
Let’s explore how
the graph looks when the number replaced is restricted to numbers between 0 and
1.
![]()
![]()
![]()
![]()
![]()
![]()
![]()
![]()
![]()
![]()
![]()
![]()
![]()
Well, it looks
like the graph, when the number is replaced by 1, creates the oval and the 0
sets the inner lining, if you will, and all other numbers between 0 and 1 fill
up the space between.
Let’s explore how
the graph looks when a constant is added to one side of the equation.
![]()
![]()
![]()
![]()
![]()
![]()
![]()
Well, it no longer makes that
elliptical shape. It does still
have a similar “hump” on the left side.
And none of them cross at the three points that they all crossed at
before: (0,0), (0,1), and (0, -1).
Next I graphed ![]() .
It produced an interesting looking 3D graph. I don’t know if it was supposed to happen, but I couldn’t
save it. Open up graphing
calculator and give it a try.
.
It produced an interesting looking 3D graph. I don’t know if it was supposed to happen, but I couldn’t
save it. Open up graphing
calculator and give it a try.