
The Department of Mathematics and Science Education
tiffani c. knight
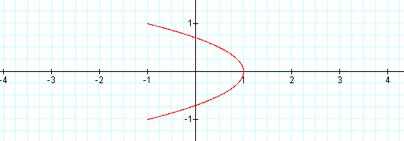
Parametrics…hmmmm. Well, first I graphed the following
three equations for 0≤ t ≤2pi:
![]()
![]()
![]()
And for all three, I got a
circle…the unit circle. Of course
my a and b for the last two were 1, which is probably why they all look the
same.
Let’s explore the last two graphs in two ways: first, when a ranges from 2 to 5 while
b stays at 1, and when b ranges from 2 to 5 while a stays at 1.
![]()
When a = 2
When a = 3
When a = 4
When a = 5
When b = 2
When b = 3
When b = 4
When b = 5
Okay, these proved to be
interesting. For ![]() ,
when b stayed constant at b = 1, I saw a pattern for a and it was based on
whether a or b was an even or odd number.
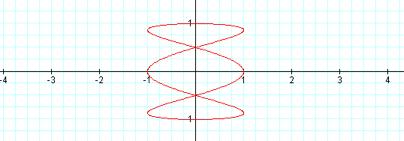
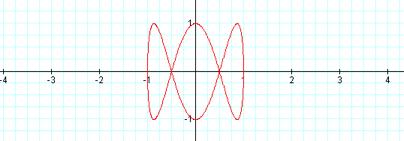
Seems like a dictates the number of times the curve will cross the
y-axis. When a was an even number,
the curve crossed a times. Look
up, when a was 2, the curve crossed the y axis 2 times and when a was 4, the
curve crossed 4 times.
,
when b stayed constant at b = 1, I saw a pattern for a and it was based on
whether a or b was an even or odd number.
Seems like a dictates the number of times the curve will cross the
y-axis. When a was an even number,
the curve crossed a times. Look
up, when a was 2, the curve crossed the y axis 2 times and when a was 4, the
curve crossed 4 times.
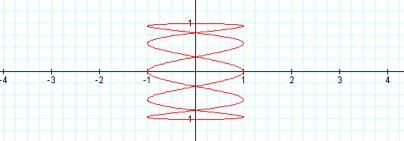
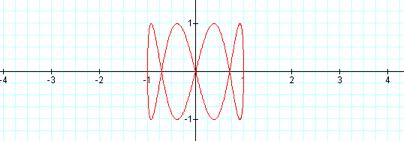
Now, when a was odd, the number
of times the curve crossed the y axis is a + 1. So, when a was 3, the curve crossed the y axis 4 times. And when a was 5, it crossed 6
times.
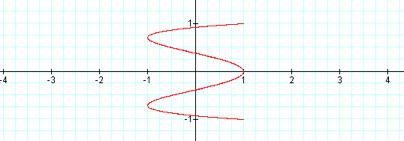
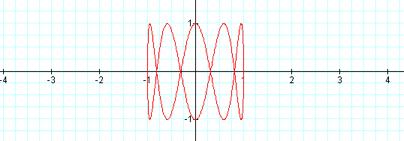
When a was kept constant at 1
and b was varied, a pattern emerged that b dictated how many times the curve
crossed the x-axis. And it didn’t
matter whether b was even or odd, the number of times the curve crossed was
b+1. So, when b was 2, 3, 4, and
5, the curves crossed the x axis 3, 4, 5, and 6 times, respectively.
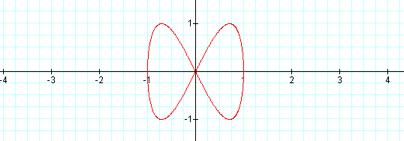
And obviously, the graphs were
no longer of circles.
![]()
When a = 2
When a = 3
When a = 4
When a = 5
When b = 2
When b = 3
When b = 4
When b = 5
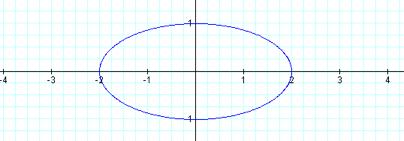
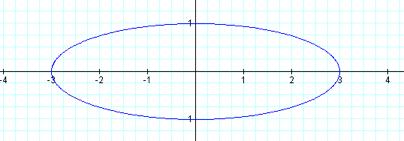
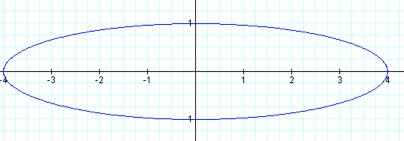
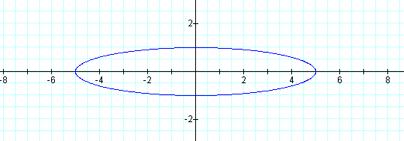
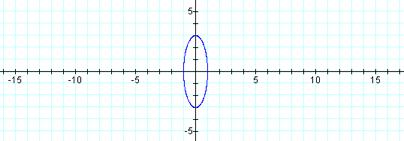
Well, for ![]() , I continued to get circles, not the unit
circle of course, but circles nonetheless. I observed a few things, the first being that when a
increased, the circle got narrower horizontally. And when b was increased, the circle got narrower
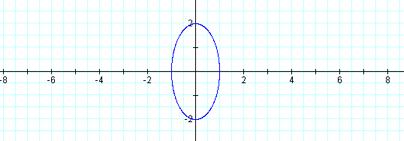
vertically. It appears that a
determines where the circle will cross the x-axis. And those two places are +a and –a. And be determines where the circle will
cross the y axis, and those two places are +b and –b.
, I continued to get circles, not the unit
circle of course, but circles nonetheless. I observed a few things, the first being that when a
increased, the circle got narrower horizontally. And when b was increased, the circle got narrower
vertically. It appears that a
determines where the circle will cross the x-axis. And those two places are +a and –a. And be determines where the circle will
cross the y axis, and those two places are +b and –b.
I wondered if this had anything
to do with me keeping a and b constant at 1, so I graphed a parametric when a=3
and b=5. I was expecting to get a
circle that touched the x axis at +3 and -3, and touched the y axis at +7 and
-7. Did I get this?
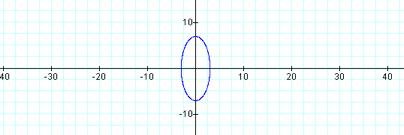
Yep! Sure did.