|
|
|
|
|
|
|
|
|
|
|
|
|
|
|
|
|
|
|
|
|
|
|
|
|
|
|
|
|
|
|
|
|
|
|
|
|
|
|
|
|
|
|
|
|
|
|
|
|
|
|
|
|
|
|
|
|
|
|
|
|

|
|
|
|
|
|
|
|
|
|
|
|
|
|
|
|
|
|
|
|
|

|
|
|
|
|
|
|
|
|
|
|
|
|
|
|
|
|
|
|
|
|
|
|
|
|
|
|
|
|
|
|
|
|
|
|
|
|
|
|
|
|
|
|
|
|
|
|
|
|
|
|
|
|
|
|

|
|
|
|
|
|
|
|
|
|
|
|
|
|
|
|
|
|
|
|
Graph the equation
|
|
|
|
|
|
|
|
|
|
|
|
|
|
|
|
|
|
|
|
|
|
|
|
|
|
|
|
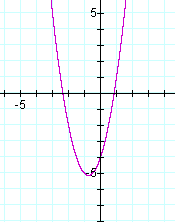
The graph is a parabola with the vertex in the 3rd quadrant, crossing the y-axis at (0,-4). Overlay this graph with a graph of the equation
|
|
|
|
|
|
|
|
|
|
|
|
|
|
|
|
|
|
|
|
|
|
|
|
|
|
|
|
|

|
|
|
|
|
|
|
|
|
|
|
|
|
|
|
|
|
|
|
|
|
|
|
|
|
|
|
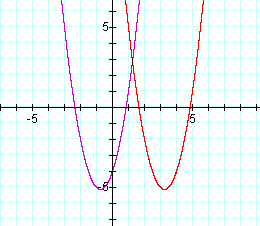
Each X in the original equation has been replaced by (X-4). See Graph 2 for the result.
|
|
|
Graph 1
|
|
|
|
|
|
|
|
|
|
|
|
|
|
|
|
|
|
|
|
|
|
|
|
|
|
|
|
|
|
|
|
|
|
|
|
|
|
|
|
Graph 2
|
|
|
|
|
|
|
|
|
|
|
|
|
|
The substitution moves the parabola 4 units to the right. Now the vertex lies in the 4th quadrant. If I had predicted the change, I would have guessed the parabola would have moved in the opposite direction.
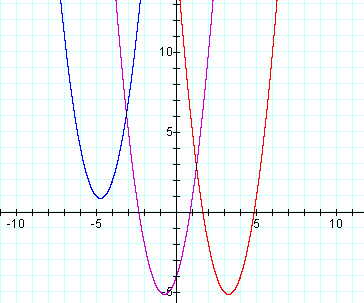
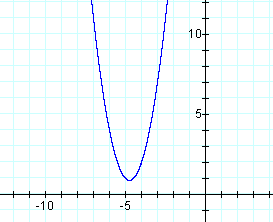
Now change the equation to move the graph into the second quadrant. If the previous substitution moved the graph to the right, substituting X+4 for X will move the graph to the left. Since the graph crosses the y-axis at -4, I took a wild guess and chose to replace -4 with +2. So let's graph the equation and see what happens. See Graph 3.
|
|
|
|
|
|
|
|
|
|
|
|
|
|
|
|
|
|
|
|
|
|
|
|
|
|
|
|
|
|
|
|
|
|
|
|
|

|
|
|
|
|
|
|
|
|
|
|

|
|
|
|
|
|
|
|
|
|
|
|
|
|
|
|
|
|
|
|
|
|
|
|
|
|
|
|
|
|
|
|
|
|
|

|
|
|
|
|
|
|
|
|
|
|
|
|
|
|
|
|
|
|
|
|
|
|
|
|
|
|
|
|
|
|
|
|
|
|

|
|
|
|
|
|
|
|
|
|
|
|
Graph 3
|
|
|
|
|
|
|
|
|
|
|
|
|
|
|
|
|
|
|
|
|
|
|
|
|
|
|
|
|
|
|
|
|
|
|
|
|
|
|
|
|
|
|
|
|
|
|
|
|
|
|
|
|
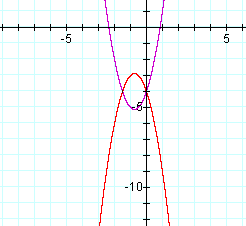
Let's change the original equation to produce a graph concave down that shares the same vertex.
If substituting X+4 and X-4 for the original X moved the graph back and forth along the x axis, would substituting -(X quantity) for each ( X quantity) flip the graph upside down?
|
|
|
|
|
|
|
|
|
|
|
|
|
|
|

|
|
|
|
|
|
|
|
|
|
|
|
|
|
|
|
|
|
|
|
|
|
|
|
|
|
|
|
|
|
|
|
|
|
Graph 5
|
|
|
|
|
|
|
|
|
|
|
|
|
|
|
|
|
|
|
|
|
|
|
|
|
|
|
|
|
|
|
|
|
|
|
|
|
|
|
|
|

|
|
|
|
|
|
|
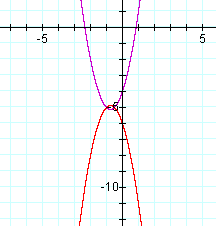
Bingo! But the two graphs don't share a vertex.They share a common point on the y-axis. I should have changed the constant 4 to something else. (See Graph 6.)
|
|
|
|
|
|
|
|
|
|
|
|

|
|
|
|
|
|
|
|
|
|
|
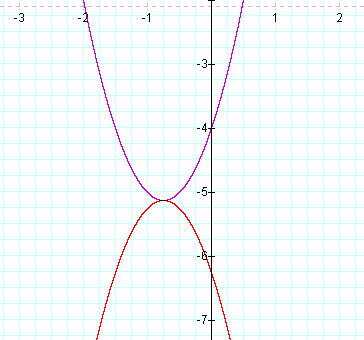
Really close, but not quite. So I cheated and let Graphing Calculator tell me that the vertex of the original graph was (-.75, -5.125). to make the vertices match, my second equation should be as follows:
|
|
|
|
|
|
|
|
|
|
|
|
|

|
|
|
|
|
|
|
|
Graph 6
|
|
|
|
|
|
|
|
|
|
|
|
|
|
|
|
|
|
|
|
|
Conclusions:
- Changing value of x moved graph to left and right along x-axis . The vertex moved the number of units by which x was altered.
- Changing the sign of the ( x quantity) changed the vertical orientation of the graph from concave up to concave down.
- Changing the constant changed the point at which it crossed the y-axis and therefore changed the y value of the vertex.
|
|
|
|
|
|
|
|
|
|
|
|
|
|
|
|
|
|
|
|
|
|
|
|
|
|
|
|
|
|
|
Graph 7
|
|
|
|
|
|
|
|
|
|
|
|
|
|
|
|
|
|
|
|
|
|
|
Return
|


