
Assignment 3: Investigating Related Parabolas
By Rebecca L. Adcock
In Assignment 2 we looked at the quadratic equation and its graph, the parabola. We’ll continue to investigate parabolas in this assignment.
Given the standard quadratic equation
![]()
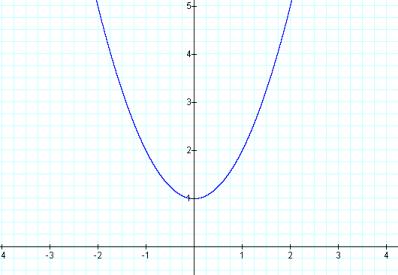
With b set to zero, the resulting graph is symmetric around the y-axis. That makes the y-axis the axis of symmetry for this equation and its graph. The vertex is (0,1).
![]()
Let’s compare what happens to the equation and the graph when we set b equal to -1 and 1.
![]()
![]()
![]()
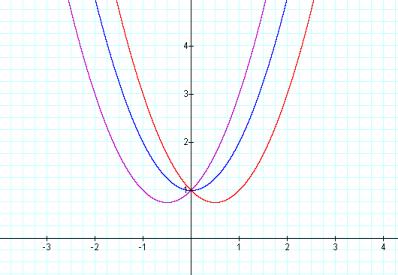
With b set to 1, the vertex shifts into the second quadrant. With b set to -1, the vertex shifts into the first quadrant. All 3 graphs share a common point at (0,1) on the y-axis. Since none of these parabola intersect the x-axis, they have no real roots.
Let’s compare this to what happens to the equation when set b equal to -2 and 2.
![]()
![]()
![]()
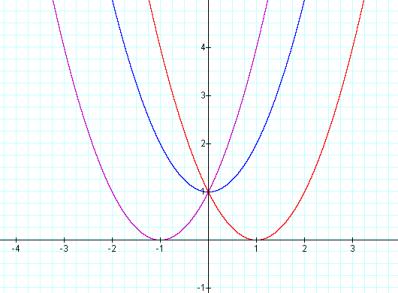
With b set to 2 or -2, the vertex drops to a point of tangency with the x-axis. Each of these parabolas has a single real root. All three graphs still share a common point at (0,1) on the y-axis.
Let’s compare this to what happens to the equation when set b equal to -3 and 3.
![]()
![]()
![]()
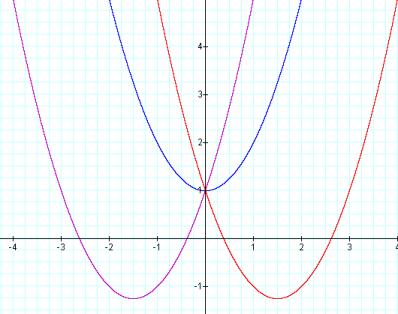
With b set to 3 and -3, the vertices fall below the x-axis. Each parabola still passes through (0,1) but now each parabola has two real root, i.e. each crosses the x-axis at two points.
Let’s put all the parabolas together and look at what happens when we draw a curve to connect all of their vertices.
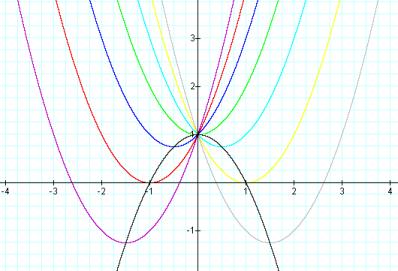
Now the question is what equation expresses the parabola (graphed here in black) that passes through the vertices of the other graphs we’ve seen.
Given the standard quadratic equation
![]()
we know if we set b=0, the parabola will be symmetric around the y-axis. So an expression for the black parabola is
![]() .
.
We’ve also seen from Assignment #2 that ‘c’ represents the graph’s intersection with the y-axis. Our intersection is the ordered pair (0,1). Substituting ‘1’ for ‘c’, our expression is
![]() .
.
Also from Assignment #2, we know that the sign of ‘a’ switches the graph from concave up for ‘+a” to concave down for ‘-a’. So now we have
![]() .
.
But what is the value of ‘a’? Notice from the graph that a root of the black curve occurs at (1,0). If we plug x=1 and y=0 into the expression above, and simplify, we have a=1. See below.

Our equation now reads
![]() .
.