
Exploring Parametric
Curves
By: Diana Brown
A parametric curve in the plane is
a pair of functions
![]()
where the two continuous functions
define ordered pairs (x,y). The two equations are usually called the
parametric equations of a curve. The extent of the curve will depend on the
range of t.
EXPLORATIONS:
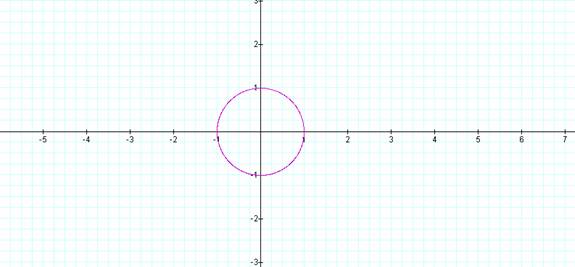
Graph
x = cos (t)
y = sin (t)
for 0≤ t ≤ 30
How would you change the equations
to explore other graphs?
For example: for various a and
b of the graphs:
x = cos (at)
y = sin (bt)
for 0 ≤ t ≤ 30
First lets investigate different
values of a and b, but keeping a = b.
a=2=b a=3=b
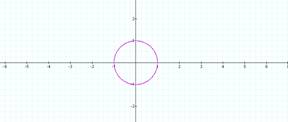
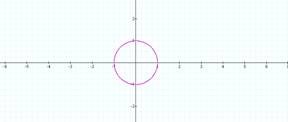
a=4=b a=10=b
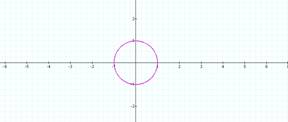
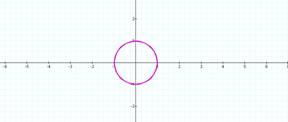
All circles.
Now lets investigate when a = 1
and b varies
b = ½ b = 2
b = 3 b = 4

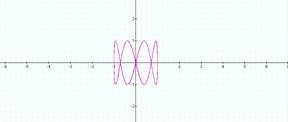
Notice that when a = 1, b
determines the number of loops
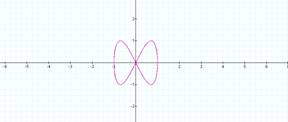
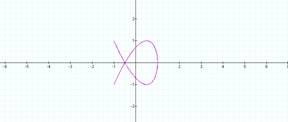
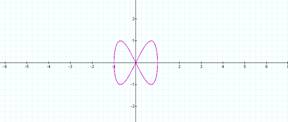
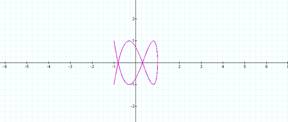
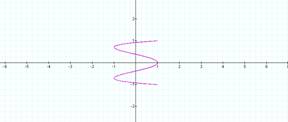
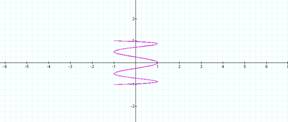
Now lets investigate when a = ½
and b varies
b = 1 b = 2
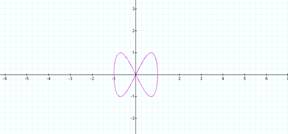
This pair creates two loops This pair
creates 4 loops
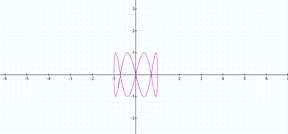
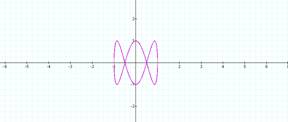
b = 3 b = 4
This pair creates 6 loops This pair
creates 8 loops
Notice that when a = ½ then the
number of loops is determined by 2b.
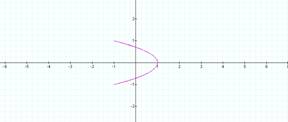
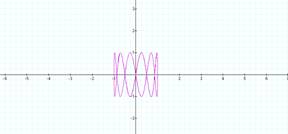
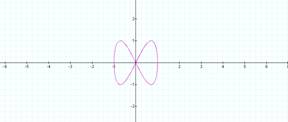
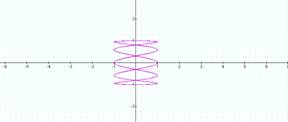
Now lets investigate when a = 2
and b varies
b = ½ b = 1
b = 3 b = 4
It now seems as though the number
of loops is determined by ½b, let’s try two more to see what happens:
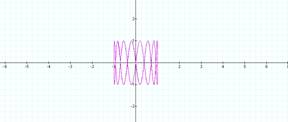
b = 5 b = 6
It seems to be so.
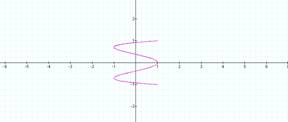
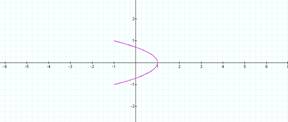
Now lets hold b to be constant and
vary a. For the following graphs b =1.
a = ½ a = 2
a = 3 a = 4
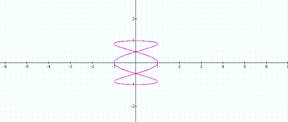
It seems to do the same as above
except about the y axis and when a is even it is open curves. Let’s try two more to see if this is true.
a = 5 a = 6
It looks as though we will get
something similar about the y axis when b is held constant and a is changing,
just as the curves were changing above when a was held constant and b was
changing.
Return
to Homepage