
Exploring the Graphs for
y = ax² + bx + c
By: Diana Brown
Construct graphs for the parabola
![]()
for different values of a, b, and c. (a, b, c can be any
rational numbers).
Case # 1:
First lets explore the graphs if
we fix a and b to equal 1 and vary the values of c for different integers. Let c = {-2, -1, 0, 1, 2}
So our equations will be:
y = x²
+ x – 2
y = x² + x
– 1
y = x² +
x
y = x² +
x + 1
y = x²
+ x + 2
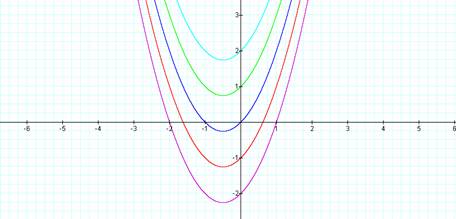
Discoveries:
We can see here that the vertex
(the lowest or highest point on the parabola) of each graph is similar. The x value is the same in each graph but the
y value varies. Remember for a given
quadratic the vertex can be computed by solving –b/2a for the x value and
substituting this x value into the quadratic to find the y value of the
vertex. Since each graph has the same a
and b, then the x value of the vertex for each equation is:
-(1)/(2*1) = -1/2. Note that each equation is not the same so if
we plug this x value of the vertex into each equation we will have different y
values for the vertex.
Case # 2:
Second lets explore the graphs is
we fix a and c to equal 1 an vary the values of b for different integers. Let b
= {-3, -1, 0, 1, 3}
So our equations will be:
y = x²
- 3x + 1
y = x² - x
+ 1
y = x² +
1
y = x² +
x + 1
y = x²
+ 3x + 1
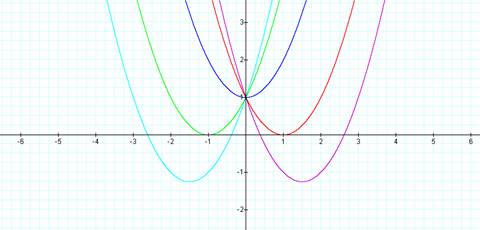
Discoveries:
We can see that in this case the
vertex changes for each graph, but seems to be reflected about the y axis. You can see that if b is negative (when a=1)
the x value of the vertex of the graph is positive, and if b is positive (when
a=1) the x value of the vertex of the graph is negative. We can also see that each graph is going
through the point (0,1) this is because as the x value of the graph is 0 and c
is equal to 1 in each graph then the above graphs share the point (0,1).
Case # 3:
Third lets explore the graphs as
we fix b and c to equal 1 an vary the values of a for different integers. Let a
= {-2, -1, 0, 1, 2}
So our equations will be:
y =
-2x² + x + 1
y = -x² +
x + 1
y = x + x
+ 1
y = x² +
x + 1
y =
2x² + x + 1
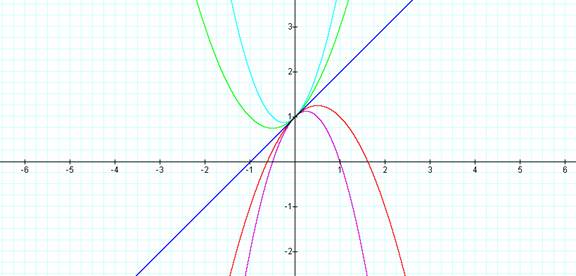
Discoveries:
Notice that if a is positive the
graph opens up, and if a is negative then the graph opens down. We also see that in comparing the red and
purple graph that the purple graph seems to be “skinnier” than the red
graph. This case is also true when we
compare the green and light blue graph.
The light blue graph seems to be “skinnier” than the green graph.
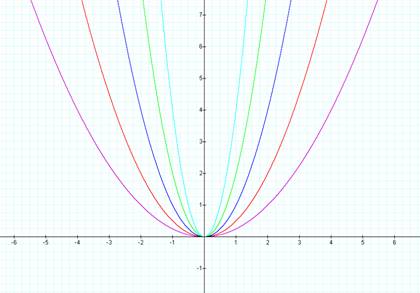
Lets take a look at some more
graphs as a is varied. (this time lets let b and c = 0)
Let’s look at:
y =
1/4x²
y = 1/2x²
y = x²
y = 2x²
y =
4x²
Let’s also look at the following
equations and their graphs:
y =
-1/4x²
y = -1/2x²
y = -x²
y = -2x²
y =
-4x²
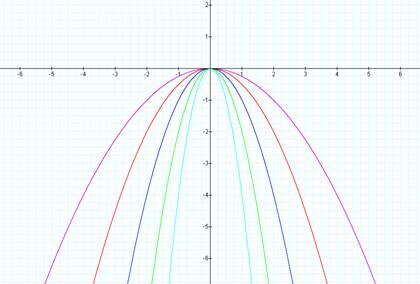
As you can see from the above
graphs, that if ׀ a ׀ > 1 that
the graph seems to be “skinnier” than the basic graph of y = x² and if ׀ a ׀ < 1 then the graph is wider than
the basic graph of y = x².
For more explorations of varying
the value of a, click here