
The roots of a Quadratic Equation
By:
Diana Brown
It has
now become a rather standard exercise, with available technology, to construct
graphs to consider the equation
![]()
and to
overlay several graphs of
![]()
for
different values of a, b, or c as the other two are held constant. From these
graphs I am going to explore the roots of
![]()
First
lets set a and c equal to 1 and let b = -4, -3, -2, -1, 0, 1, 2, 3, 4. See the below graph:
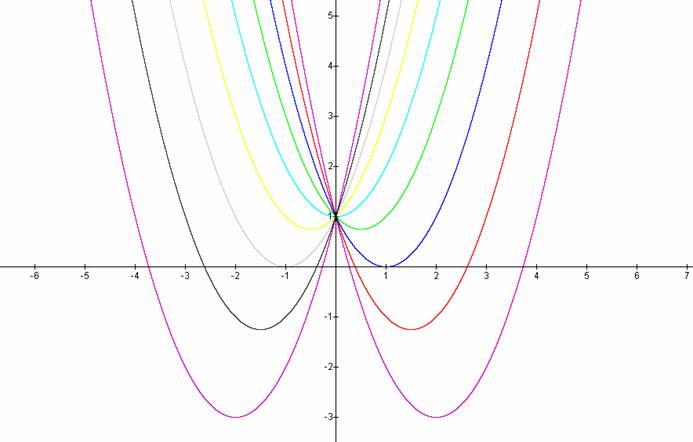
Notice
in the graph above the parabola always passes through the same point on the
y-axis (the point (0, 1) with this equation). For b < -2 the parabola will
intersect the x-axis in two points with positive x values (i.e. the original
equation will have two real roots, both positive). For b = -2, the parabola is
tangent to the x-axis and so the original equation has one real and positive
root at the point of tangency. For -2 < b < 2, the parabola does not
intersect the x-axis -- the original equation has no real roots. Similarly for
b = 2 the parabola is tangent to the x-axis (one real negative root) and for b
> 2, the parabola intersects the x-axis twice to show two negative real
roots for each b.
Remember the roots (sometimes also called "zeros") of a
quadratic equation, f(x) =0, are the values of x for which the equation
is satisfied. Lets derive a formula to
find the solution of a quadratic equation:
Consider the equation
![]()
The
roots x can be found by completing the square,
![]()
![]()
![]()
Solving for x then gives
![]()
Note that this is the quadratic formula and this formula is used
to find the roots of a quadratic equation.
Now let’s look at
the locus of the vertices of the set of parabolas graphed from above:
|
EQUATION |
VERTEX |
|
y = x² - 4x + 1 |
(2, -3) |
|
y = x² - 3x + 1 |
(1.5, -1.25) |
|
y = x² - 2x + 1 |
(1, 0) |
|
y = x² - x + 1 |
(0.5, 0.75) |
|
y = x² + 1 |
(0, 1) |
|
y = x² + x + 1 |
(-0.5, 0.75) |
|
y = x² + 2x + 1 |
(-1, 0) |
|
y = x² + 3x + 1 |
(-1.5, -1.25) |
|
y = x² + 4x + 1 |
(-2, -3) |
See the graph of the locus of the vertices of the parabolas:
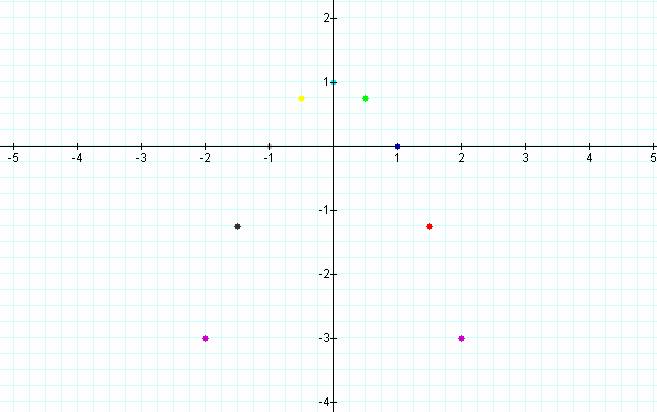
Notice
that the locus is a parabola. We can see
that the vertex of the above parabola is at (0, 1) and that each point is
symmetric to each other about the line x=0.
Also the x intercepts are at the points (1, 0) and (-1, 0). If we set y = to the roots of the equation we
obtain:
y= (x –
1) (x + 1)
y = x²
- 1
and,
since the parabola is opening down therefore a must be negative so lets see
what happens when we graph the equation y =
-x² + 1 on the above graph:

As you can see in the above
graph, the locus of the vertices of the set of parabolas graphed from y = x² +
bx + 1, in the beginning of the exploration is the parabola:
![]() .
.