 Assignment #12
Excel Spreadsheet Explorations
By Jennifer Byrd
Assignment #12
Excel Spreadsheet Explorations
By Jennifer Byrd
For this assignment
I will investigate a function y=f(x) using Microsoft Excel. There
are many different forms of Excel but for this assignment I will
use the Workbook.
y=x^2-5
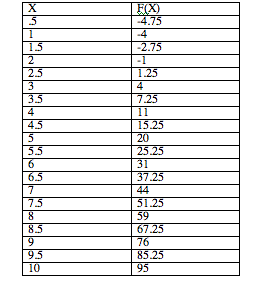 This will be my data set for the assignment.
I manually put all 20 of the x-values in then I set a formula
for f(x). Excel is very helpful in this way because you do not
have to compute y for every x-value, the program will do it for
you!! By typing the formula into the second column of the first
row then copying the formula and dragging it down the rest of
the second column, this will compute y=f(x). Excel can also graph
the function using the Chart wizard. Let's see what it looks like.
This will be my data set for the assignment.
I manually put all 20 of the x-values in then I set a formula
for f(x). Excel is very helpful in this way because you do not
have to compute y for every x-value, the program will do it for
you!! By typing the formula into the second column of the first
row then copying the formula and dragging it down the rest of
the second column, this will compute y=f(x). Excel can also graph
the function using the Chart wizard. Let's see what it looks like.
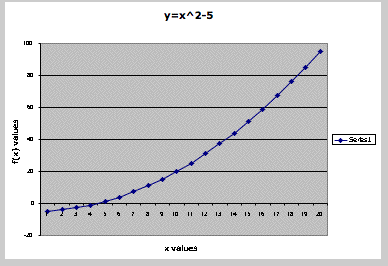 Excel can also construct
many other types of graphs and charts. Bar graphs, pie charts,
and scatter plots are other options under the Chart wizard.
Excel can also construct
many other types of graphs and charts. Bar graphs, pie charts,
and scatter plots are other options under the Chart wizard.
Return