
EMAT 6680
Assignment 11: Polar Graphs
by
Tom Cooper
For this assignment, I
decided to study the following polar functions:
![]()
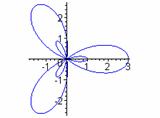
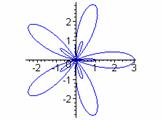
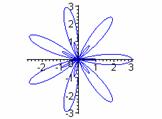
I began by exploring graphs with Graphing Calculator 3.2. For
it quickly becomes apparent that there
are two classes of graphs, depending on the parity of k.
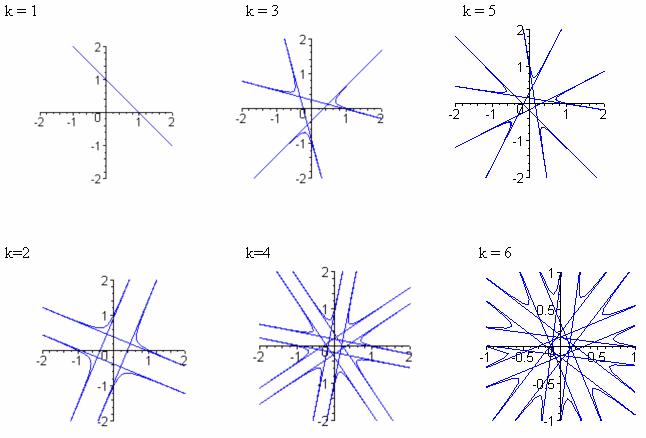
The following shows the
graphs of
for whole number k values ranging from
1 to 8. They are organized into even and odd cases.
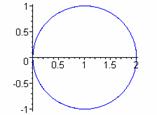
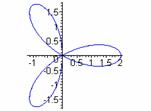
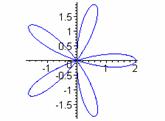
k = 1 k = 3 k = 5 k = 7
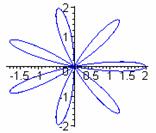
k=2 k=4 k = 6 k = 8
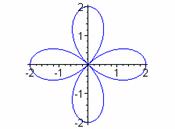
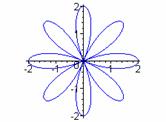
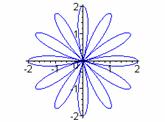
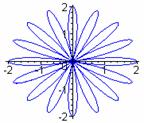
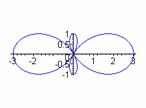
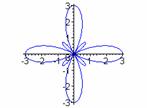
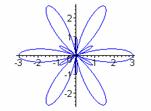
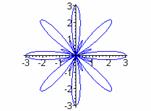
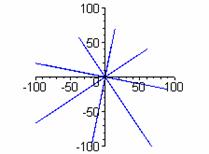
From these examples, we see evidence that when k is odd, the graph has k congruent petals.
When k is even, there are 2k congruent petals. To explore different values of k, click here and animate or drag the slider.
The animation seems to indicate that all of the graphs have 2k petals, but pairs overlap when k is odd.
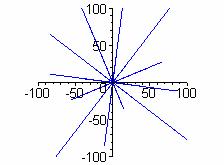
You will see very similar
results with
 .
.
The only difference is a
rotation in the graphs. To explore this case for different values of k, click here.
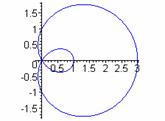
Next we observe the effects of adding 1 to these equations giving
![]()
In the Cartesian coordinate system, we would expect a vertical shift, but that is not what is observed here.
![]()
k=1 k = 3 k = 5 k = 7
k = 2 k = 4 k = 6 k = 8
We see that there are k congruent large petals and k smaller congruent petals. For even k values, the petals are equally spaced, alternating large and small in a circular pattern. For odd values of k, each larger petal contains a smaller petal. Exploring in Graphing Calculator, one will discover that as b moves from 1 toward 0 in
![]()
the sizes of the smaller petals approach the sizes of the larger petals. When b = 0, they are the same size as the larger petals. This reinforces the observation that there are 2k petals in all the graphs of
![]()
shown above, but they overlap when k is odd. To explore this yourself, click here. The value of k is controlled by the usual slider at the bottom, and b is controlled by a slider in the input section.
Again
![]()
behaves similarly, but it is rotated about the origin. Click here to explore.
Exploring these functions, it is only natural to look at a combination of them,
![]() .
.
As you might expect, these are some very interesting graphs.
Plotting in a large window with c = 1, we observe the following
k=1 k = 3 k = 5
k = 2 k = 4 k = 6
Keep in mind that graphing devices simply plot a very large number of points, so there could be some errors in these representations. Perhaps, there is more symmetry than appears. There seems to be a global behavior of 2k "pieces."
Using a much smaller window reveals some beautiful patterns near the origin.
Observe the symmetry and the fact that the "star" in the center always has k points when k is odd and 2k points when k is even. You can explore these graphs here.
Finally for some really interesting graphs, try
![]() .
.
Click here for a Graphing Calculator file.