by Kristina Dunbar, UGA
![]()
by Kristina Dunbar, UGA
![]()
The amplitude of a sine curve is its height.
The period of the sine curve is the length of one cycle of the curve. The natural period of the sine curve is 2π. So, a coefficient of b=1 is equivalent to a period of 2π. To get the period of the sine curve for any coefficient b, just divide 2π by the coefficient b to get the new period of the curve.
The coefficient b and the period of the sine curve have an inverse relationship, so as b gets smaller, the length of one cycle of the curve gets bigger. Likewise, as you increase b, the period will decrease.
The phase shift of a sine curve is how much the curve shifts from zero. If the phase shift is zero, the curve starts at the origin, but it can move left or right depending on the phase shift. A negative phase shift indicates a movement to the right, and a positive phase shift indicates movement to the left.
As you look at the graph, remember that the numerical value of π is approximately 3.1416, so 2π is approximately 6.2832.

In the above graph
The amplitude a is 1. This means that the height of the graph will be 1, and the top of the first "hump" is 1.
The period b has a coefficient of 1, so the period is (2π)/1, or just 2π.
The phase shift c is zero, so the curve starts at the origin.
![]()
Return to my Home Page.
![]()
Let's examine the sine curve with different amplitudes.
We've already seen the case where the amplitude is 1; it's in the above graph. What about other amplitudes?
y = 2 sin x


y = -1 sin x

What's different about the above graph? It has a coefficient of a = -1. What does that mean? We see that the highest point of the curve is still 1, but the first hump is at -1 instead of 1. We've essentially flipped the graph over.
Now let's look at several different sine graphs together.


![]()
Return to my Home Page.
![]()
Let's examine the sine curve with different periods.
We've already seen the case where the b coefficient is 1; it's in the above graph. What about other periods?
Remember, the b coefficient and the period of the curve have an inverse relationship.

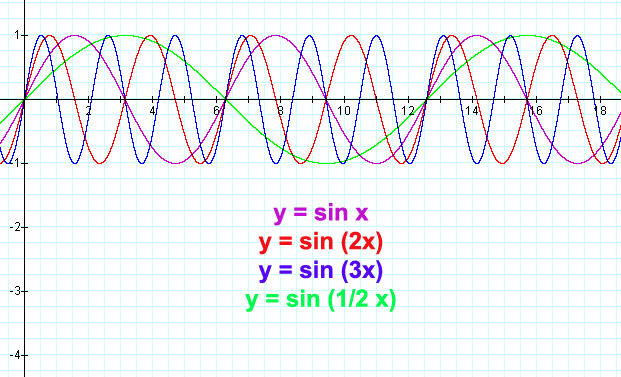
The coefficient b in the above graph is 2, so the period of the sine curve changed by a factor of 1/2, making the new period π, or about 3.14.
y = sin (.5x)

For the above graph, the coefficient b = 1/2, so the period of the sine curve will be twice as long as it usually is, or 4π.
y = sin (3x)

Now let's look at several different sine graphs together, with different periods.
![]()
Return to my Home Page.
![]()
Let's examine the sine curve with a phase shift.
Normally, the sine curve does not have a phase shift, so the variable c is 0. This means that the sine curve starts at the origin, as shown in the first graph at the top of this page.
What about when c is not equal to zero?
y = sin (x + π)
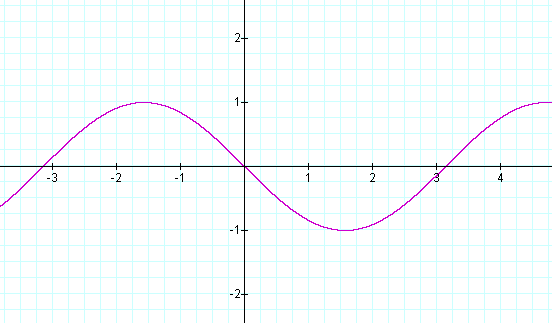
In fact, a positive phase shift c actually indicates a shift to the left. Let's look at some more examples:
y = sin (x + 1)
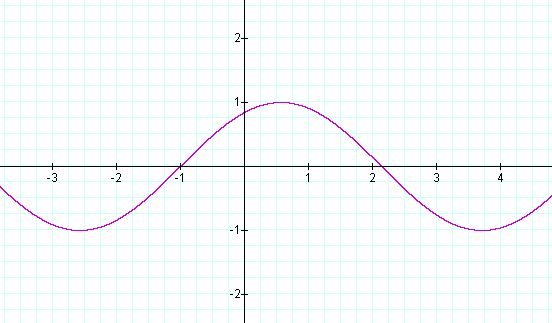
The sine curve shifted one unit to the left.
y = sin (x + π/2)
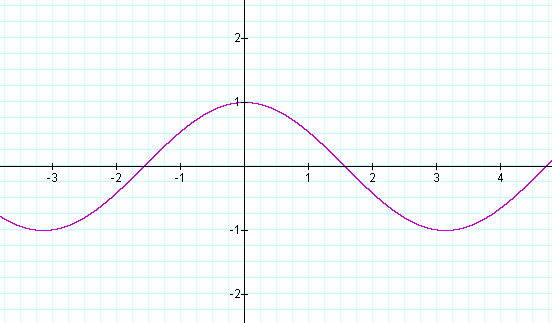
The curve shifted π/2 units to the left. Recall that π/2 is approximately 1.57.
What if the variable c is negative?
y = sin (x - 1)
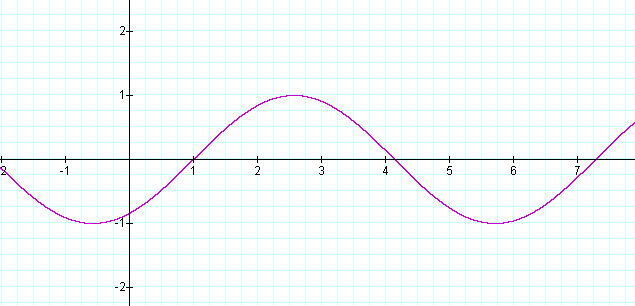
The curve shifted 1 unit to the right.
y = sin (x - π/2)
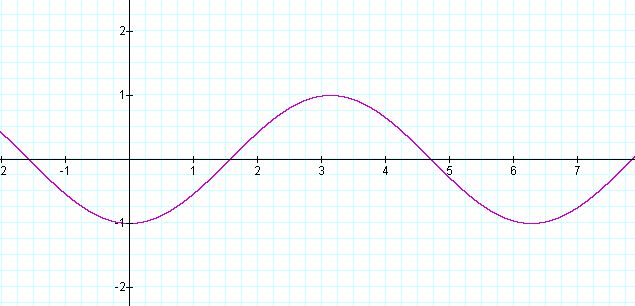
Let's look at a few phase shifts together:
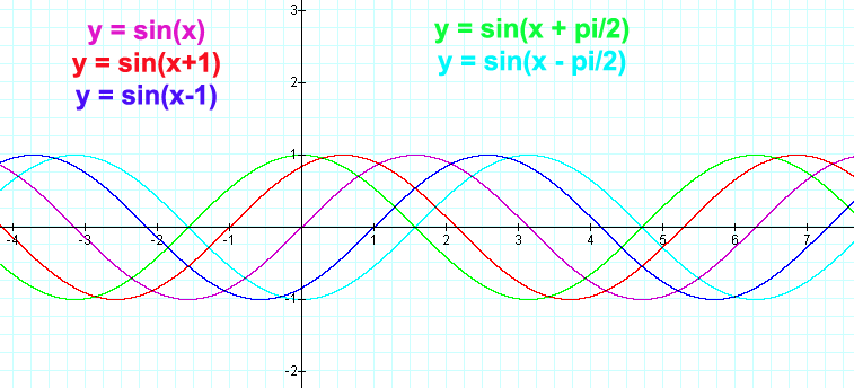
Note: A phase shift of π will look exactly the same as a phase shift of -π.
y = sin (x + π)

y = sin (x - π)

![]()
Return to my Home Page.
![]()
In the above exercises, we have explored what happens to the sine curve when we vary the coefficients a, b, and c individually. What if you varied more than one at a time?
y = 2 sin (2x)
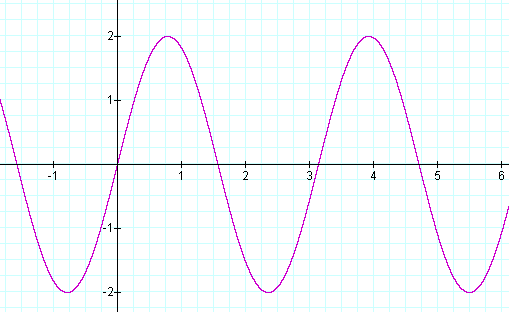
a = 2 b=2 c=0
The amplitude is 2 and the period is 2π/2, or π. There is no phase shift.
y = 2 sin (2x -1)
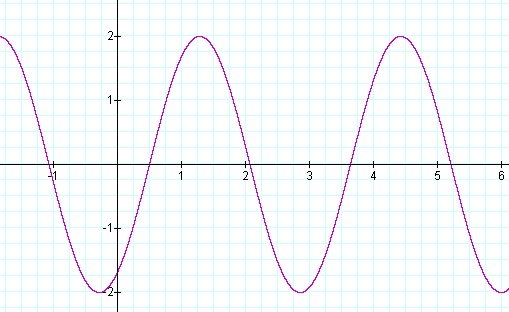
a = 2 b = 2 c = -1
The amplitude is 2 and the period is 2π/2, or π. The entire curve is shifted one unit to the right.
y = 3 sin (2x + 2)
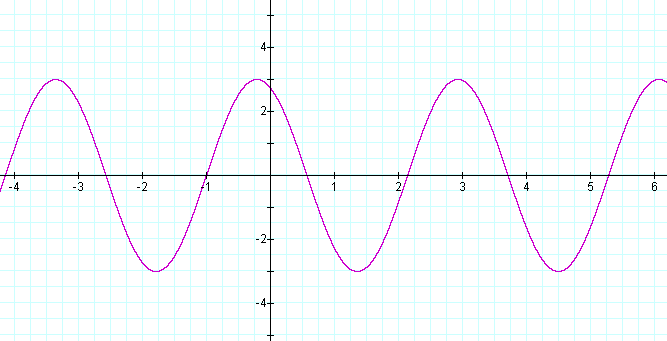
a = 3 b = 2 c = 2
The amplitude is 3, as we would expect. The period of the graph is 2π/2, or π. We would expect the phase shift to be two units to the left, but we see that that is not the case. Why? Because the phase shift is in relation to the period. The period of the graph is 1/2 its original size, and therefore the phase shift will also be 1/2 of the c coefficient, or 1. This is shown in the graph above.
y = .5 sin (.5x -3)

a = .5 b = .5 c = -3
The amplitude is .5, which we see clearly in the graph. The coefficient b is .5, so the period of the sine curve is twice what it normally is, or 4π (approximately 12.57). Because the period of the curve is twice what it normally is, the phase shift will be twice the c coefficient, or 6 units to the right.
![]()
Return to my Home Page.
![]()
Would you like to work some practice problems? Click here.