Using Excel to Graph Equations
by Kristina Dunbar, UGA

You can also use Microsoft Excel to graph equations of functions. The below spreadsheet finds the values for
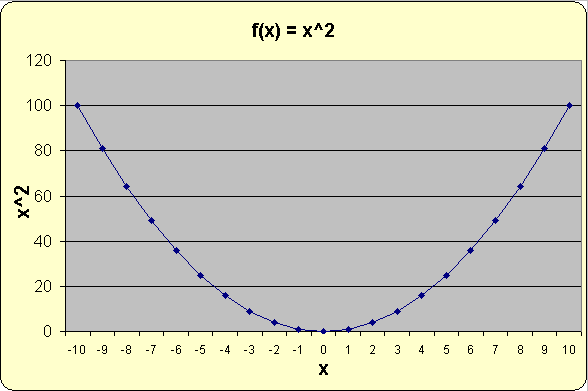
f(x) = x2,
where x ranges from -10 to 10.

To find the values for the B column, you need to create an equation. For example, B2 =A2^2. You can click in the bottom right-hand corner of cell B2 and drag it down so that the equation fills out the cells below.
Here is what a graph of f(x) = x2 looks like in Excel:

Click here for the Excel file used to create this data.
