Assignment 1: Studying the Graph y = asin(bx+c)
The purpose of this assignment is to examine the graphs of the equation y=asin(bx+c) for different values of a, b, & c.
Click on the equation y=sinx, which will show the standard shape of the graph.
Click on the equation y=asinx, which will show the graph when b and c are held constant and a is changed.
Notice that as a is increased, the y-value of the graph increases, but the position on the x-axis and y-axis does not change.
Click on the equation y=sinbx, which will show the graph when a and c are held constant and b is changed.
Note that the larger b is, the more compressed the graph is. In other words, when b=2, the graph is more spread out than when b=3. The graph is shifting on the x-axis and compressing as the value of b increases.
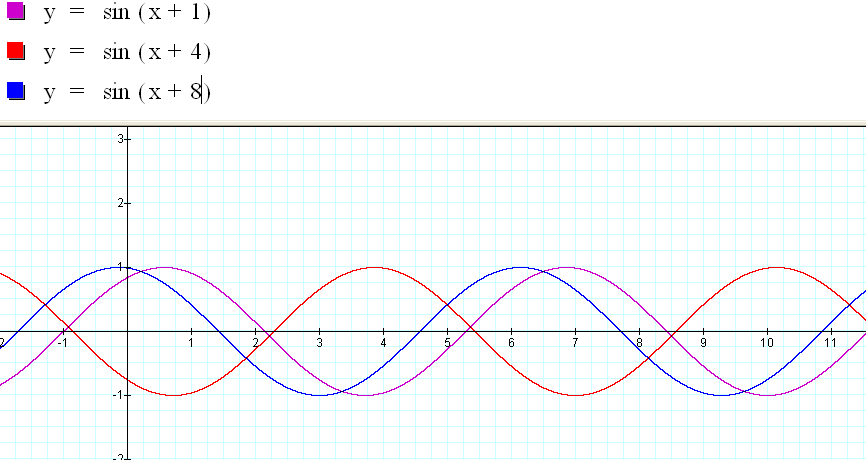
Click on the equation y=sin(x+c), which will show the graph when a and b are held constant and c is changed.
Notice that the graph shifts on the x-axis by the value of c, but the shape of the graph does not change.