Assignment
12:
Explorations
with Spreadsheets
Michelle
Greene
Spreadsheet programs such as
Excel are excellent programs that can be used to quickly generate
a table of values.
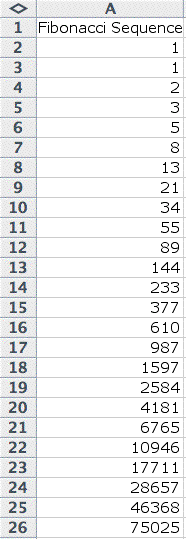
Let's take a look at the Fibonacci
Sequence generated using Excel.
| It is easy to see that
this sequence gets large very quickly. In order to generate the
Fibonacci Sequence, I simply entered the first couple of numbers
into A2 and A3. Then, in A4, I assigned the function "=A2
+ A3" and then filled down. This generated the sequence
I was after. |
 |
Now, let's explore some ratios
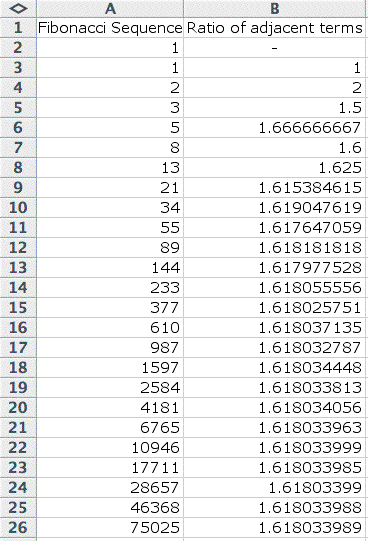
within this sequence. Let's look at the ratio of adjacent terms
in the sequence.
|
To illustrate this, I just added another
column to my data. In this new column, the data consisted of
the ratio of the number to the left of it to the number to the
left and up one. For example, in B3, I gave the command "=A3/A2"
and filled down.
Notice that the ratio converges to about 1.618.
What does this number represent? The golden ratio, of course!
|
 |
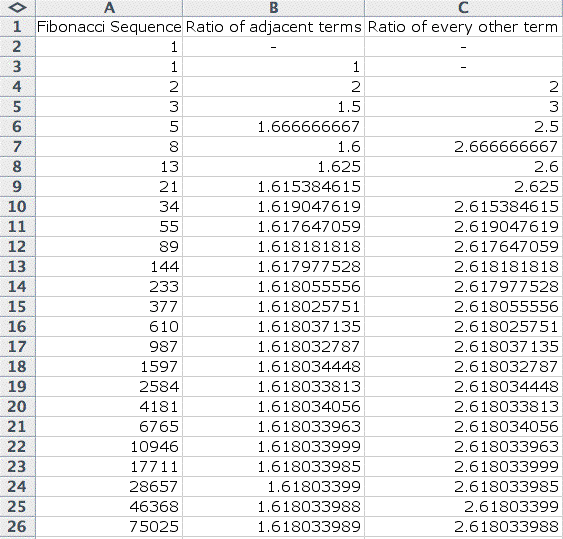
What about the ratio of every
other term? Let's add on another column and take a look at these
ratios.
|
Beginning in C4, I simply gave the command
"=A4/A2" and filled down.
Notice that this ratio converges to about
2.618. What is special about this number? How does it relate
to the previous ration, the golden ratio? Well, it is the golden
ratio squared.
|
 |
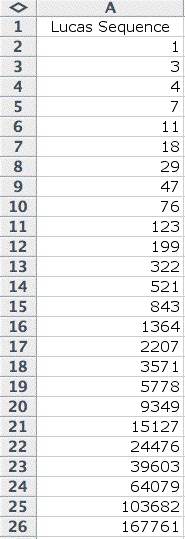
Let's look at another sequence,
known as the Lucas Sequence.
| This sequence is similar
to the Fibonacci Sequence, but it begins with f(0) = 1 and f(1)
= 3. Then f(2) = f(0) + f(1) and so on. So in A4, I gave the
command "=A3+A2" then filled down. This gave me the
Lucas Sequence. |
 |
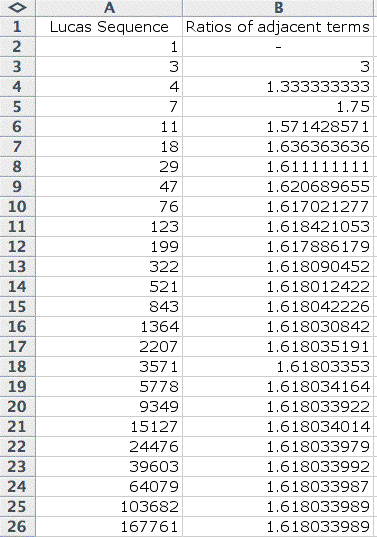
What happens if we take the
ratios of adjacent terms from this sequence? Let's have a look.
| Here, I used the same command
that I used with the Fibonacci Sequence. This ratio also converges
to about 1.618, the golden ratio! |
 |
Return


