Let's have another look at the feasible region:

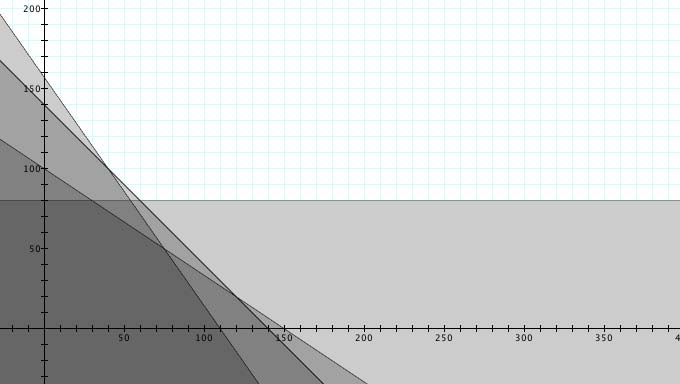
This feasible region includes the point on the graph where the Woos would make the most profit.

Our next goal is to find the point on the graph where the most profit can be made. Say, we are a consulting team and we are to help the Woos figure out what they need to do in order to make the most profit. We must be clear with our explanation so that we will be chosen again to help consult.

First, let's figure out what point on the graph gives maximum profit:

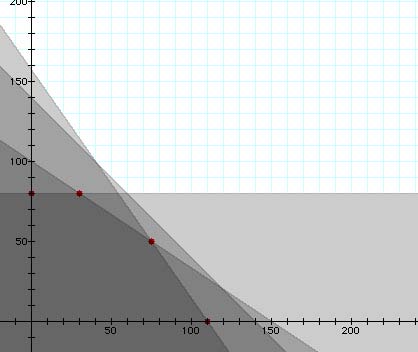
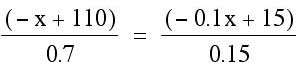
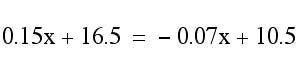
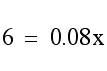
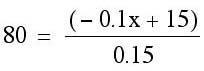
We know that the maximum profit point is represented by one of the intersection points shown above. How do we find these points? The two on the axes are easily obtained: (0,80) and (110,0). We need to set the equations of intersecting lines equal to each other to get an ordered pair for the remaining two points.

To get one of the intersection points, we should set up the following equation:

This implies that y = 50.

Remember that initially, our graph had iced cookies on the y axis and plain cookies on the x axis. So, the above information tells us that the intersection point (75, 50) is the point on the graph representing when there are 75 plain cookies and 50 iced cookies.

What about the final intersection point?

This implies that y = 80.

So, this gives us the ordered pair (30,80), meaning that at this point, 30 plain cookies and 80 iced cookies were made and sold.

Once again, our ordered pairs are as follows: (p,i) = 1.) (0,80), 2.) (110,0), 3.) (75,50), and 4.) (30,80).

Recall our profit formula: Profit = 1.5p + 2i.

By plugging in our ordered pairs, we will see which gives the maximum profit.

1.) (0,80) => Profit = 1.5(0) + 2(80) = $160.00

2.) (110,0) => Profit = 1.5 (110) + 2 (0) = $165.00

3.) (75,50) => Profit = 1.5(75) + 2 (50) = $212.50

4.) (30,80) => Profit = 1.5(30) + 2(80) = $205.00

So, the maximum profit is $212.50, which happens if the Woos bake and sell 75 plain cookies and 50 iced cookies.


Back to title page

See another short application of the feasible region