Day 3:
Using Line of Least Squares to Predict Outcomes of Data
Katherine Huffman & Brooke Norman
Objectives:
To apply the previous days knowledge to gain an understanding of
methods for predicting outcomes for various given conditions.
To investigate several real world applications of using line of
Least Squares for prediction.
Technology:
Fathom2
The goals of this lesson are to ensure the students understand what the
line of least squares is and what information it provides about the
data set as well as how to use the line of least squares to make
predictions about future outcomes. This lesson uses the survey
that the students completed on the first day of the unit to make it
appear more pertinent to their lives. The students will
ultimately be responsible for understanding how to use line of least
squares to make predictions and some of the different uses for these
predictions.
Lesson:
Begin by discussing what the students have learned about line of least
squares. Reiterate that the line of least squares provides the
equation of a line that approximately follows the trend of the data
set. Also discuss the importance of outliers and how they can
affect the trend of a data set. IF an outlier is too extreme it
can have a grave effect on the line of least squares. Removing
this point can often help to find a better fit for the line of least
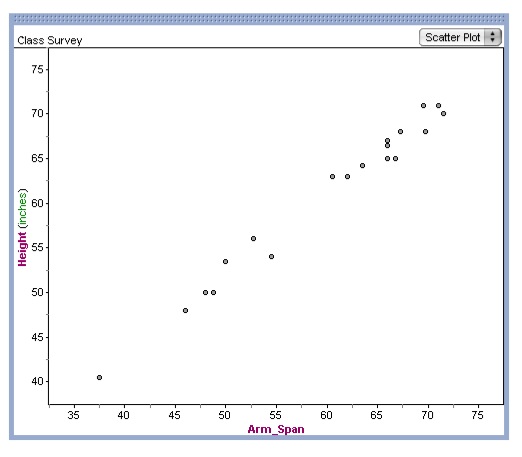
squares. After the review discussion, have the students begin
working in Fathom2 again. They will begin by creating a scatter
plot of two sets of data. In our example we will use height
versus arm span. It is said that a persons arm span is supposed
to
be the same as their height. Therefore we know this is a linear
relationship. So we will graph the data points in a scatter plot
using Fathom2.
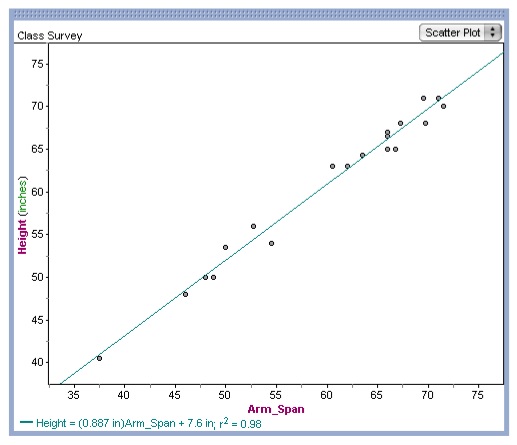
Next, plot the line of least squares.
Discuss how this line could be used for prediction purposes. Why might people use this line to predict
future outcomes? What other
types of predictions can the line of least squares be used for?
Are there any restrictions for using
the line of least squares to make predictions about different outcomes?
With the least squares line plotted students can make predictions using
Fathom2 one of two ways. First, the equation for the line of
least squares is provided at the bottom of the graph. In our
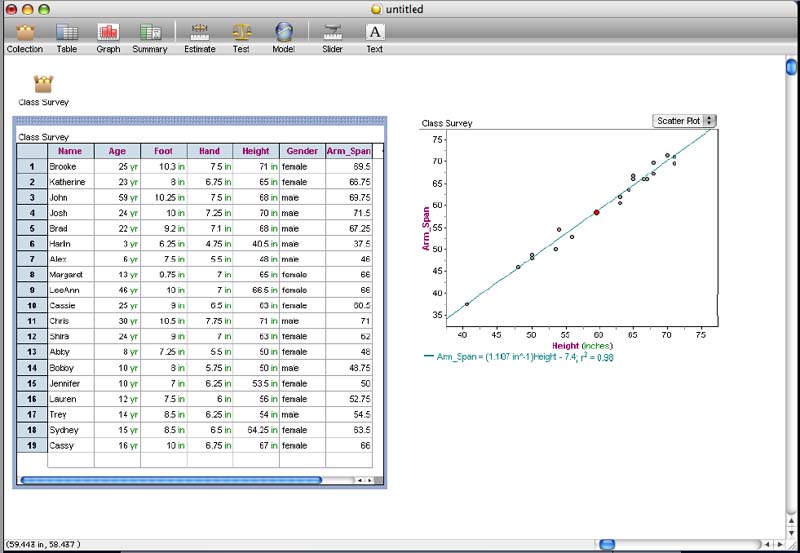
example, Arm_Span = (1.107in)Height - 7.4. So, if a person was 60
inches tall, then their arm span would be, Arm_Span = (1.107in)Height -
7.4 = Arm_Span = 66.42 - 7.4 = 59.01 in. Therefore, someone who
is approximately 60 inches has an arm span of approximately 59
inches. Now the students can check this prediction using
Fathom2. Hovering their cursor over the line of least squares
will give them a cross hair with a red dot in the center. This
red
dot is the point on the least squares line. In the bottom left
hand corner of the Fathom2 window will be the coordinates of this red
dot. The students will move the cross hair up and down the line
until the desired x-value is found. In the below example, we are
checking the arm span for a person who is 60 inches tall. We can
not get an x-value of exactly 60, so we will choose the closest
approximation, which is 59.443 inches. According to our
prediction using Fathom2, a person who is approximately 60 inches tall
should have an arm span of approximately 58.5 inches.
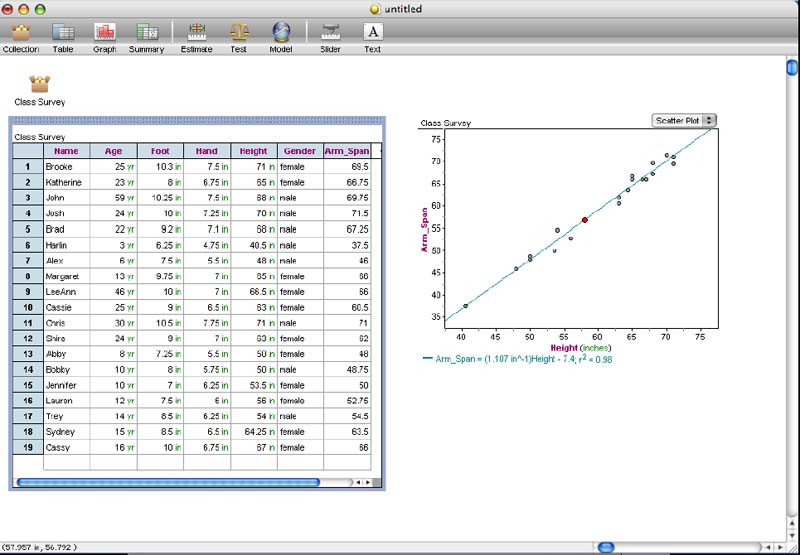
In this next example, we are using the least squares line in Fathom2 to
predict the arm span of a person who is approximately 58 inches
tall. We move the red dot up and down the line of least squares
until our desired x-value of 58 inches is found. In this case,
the closest we could get to 58 is 57.957 inches. For this height,
a person should have an arm span of approximately 56.792 inches.
Therefore we can guess that a person who is approximately 58 inches
tall would have an arm span of approximately 57 inches.
Once the students understand how to use Fathom2 to plot data and make
predictions they can complete an activity individually that will
utilize this knowledge. The activity is shown below. To
view this activity in word format click here.
For the Fathom2 document of this activity click here.
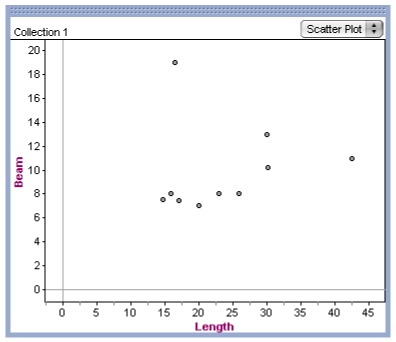
We are given the following data about ten different sailboats:
Length
|
Beam
|
17.2 ft
|
7.4 ft
|
14.76 ft
|
7.5 ft
|
30 ft
|
13 ft
|
23 ft
|
8 ft
|
42.5 ft
|
11 ft
|
16.5 ft
|
19 ft
|
26 ft
|
8 ft
|
20 ft
|
7 ft
|
16 ft
|
8 ft
|
30.25 ft
|
10.25 ft
|
Now, using Fathom2, create a table of this data. Begin by
clicking the table icon and dragging a table onto the blank Fathom
document. Type the labels in the first row, pressing Tab to cycle
between columns. After typing the labels for each column, click
the in the second row under the first label. Type in the data as
shown above, cycling between columns by pressing Tab.
Once all the data has been input, you will create a scatter plot of the
data to look at length versus beam.
Now find the line of least squares. What is the equation of this
line?
Do there appear to be any outliers influencing this line? Why do
you believe this to be so?
If so, remove these outliers by clicking on them and going to Edit,
Delete Case. What is the equation of your new least squares line?
What do you believe would be the length of the beam of a sailboat that
is approximately 27 feet long? (9.3 ft)
How did you find this value?
Why does this method work?
What is another method you might use to find this value?
The assessment for this Days lesson is the activity that the students
should complete. They are expected to print out their progress in
Fathom2 as well as provide written answers to the posed questions.
Previous Days Lesson
Return to Homepage