
by Soo Jin Lee and Jaehong Shin
This is a Microsoft Excel file to illustrate interation of a seed point (x(0), y(0)) by the sequences x(n+1) = 1 - y(n) + abs(x(n)) and y(n+1) = x(n). This point is iterated 500 times and the points plotted in an XY scatter plot. Explore the iteration of various points (x,y) by seeding the initial value of x in cell A1 and the initial value of y in cell B1.
1 objective.
Find the difference by changing the value of X in cell A1.
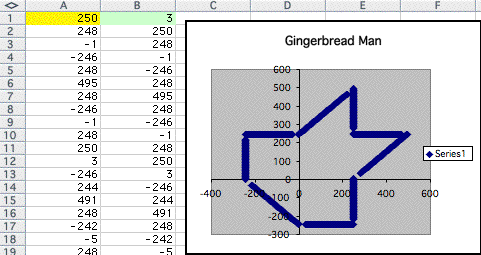
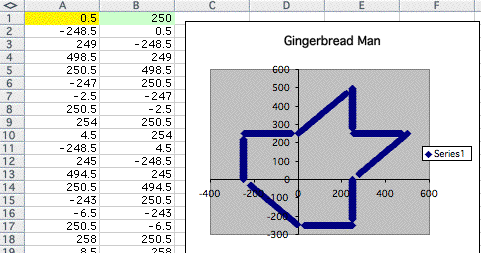
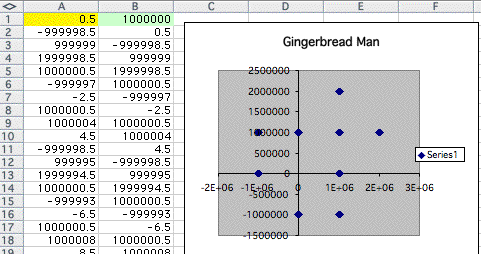
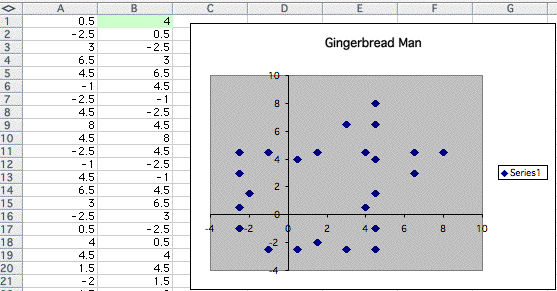
The graph we have below is the original graph when we put 0.5 into the cell A1.

if you want to look all the point completing the above graph, please click here.
By using the same function, I tried to explore how the shape of gingerbread changes as we replace another number to A1.
If I replace 0.6 in A1,

I got more clear picture of gigngerbread man.
What if I put 0.9 in A1? I guess the picture will look much clearer.

As I guessed, I got more distinct picture of gingerbread man.
Then here is my first conjecture.
I guess as a number increases I will have much clearer gingerbread man.
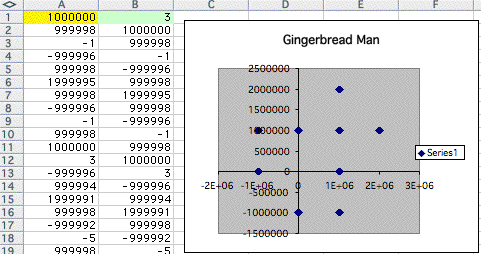
Let's look at the graph below. As we can see, it turned into a simple five points!

However if I substitute 1.1 in A1, it returns to the gingerbread.

Now I came up with another question.
Is the gingerbread man change into the points if I put natural number instead of decimal number?
Let's put 2 into the A1,


by keep doing this process, I came up with some interesting results.
As the number increases, it changes to other strange polygon like below.


When I replace negative natural numbers, the result was same.
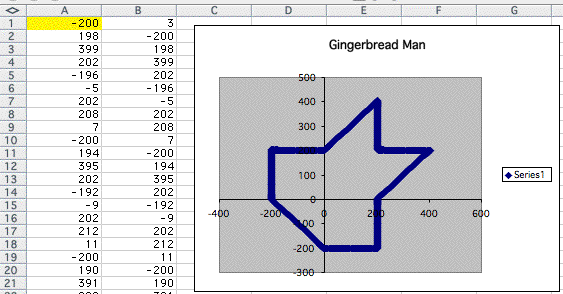
Is that polygon only appears when A1 is replace by natural numbers?
first, the answer is NO!!!
I tried several occassions and I could see, from some point point below 10, gengerbread man never appears again.

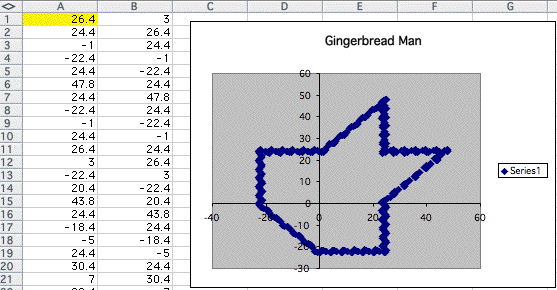
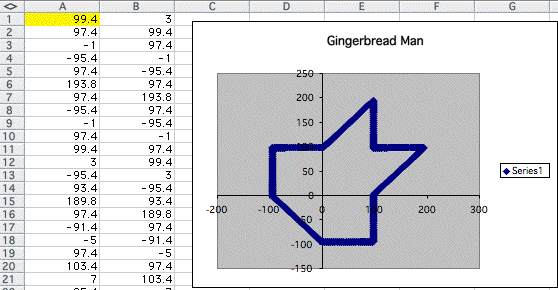
At this point I can conclude that the shape of the graph get closer to the above one as interger in A1 increases.
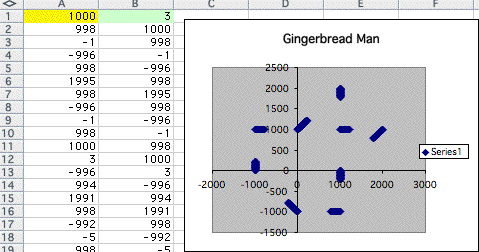
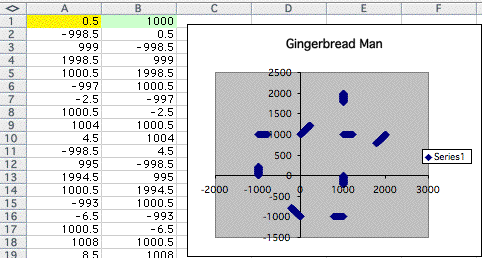
However if the integer in A1 exceeds 240, that shape also changes.
It starts to split. Let's look at some examples.
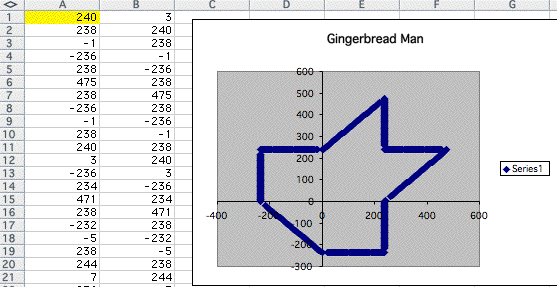
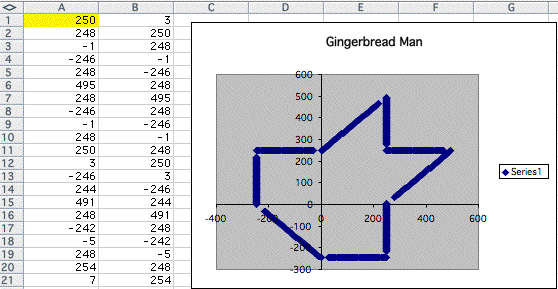
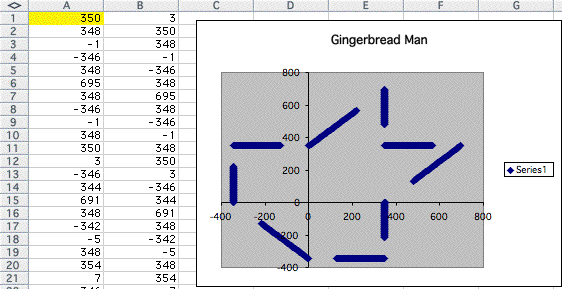
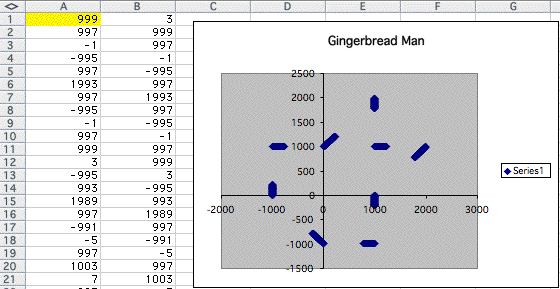
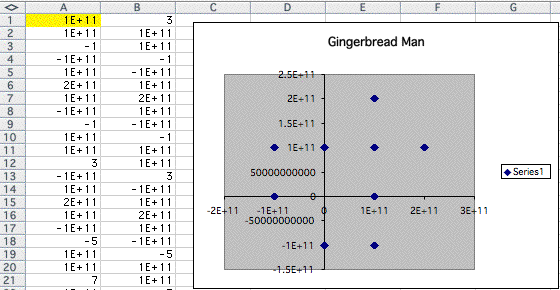
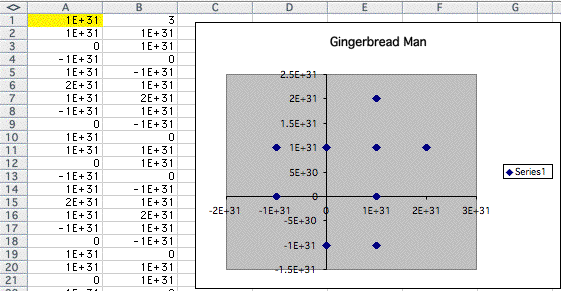
As the number goes infinity, there are no shapes remain now. Only some point remain as we replace 3 in A1 and 5 in A1.
objective 2
Find the difference by changing the value in the cell B1.
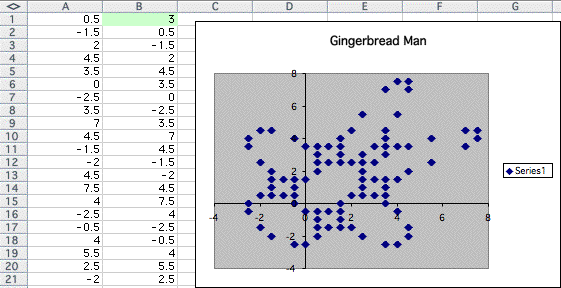
The above graph waas the original shape!
We have gingerbread. Let's see what happens as we increase the number of the value in the cell B1.
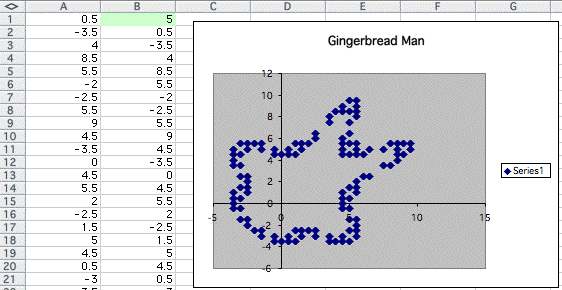
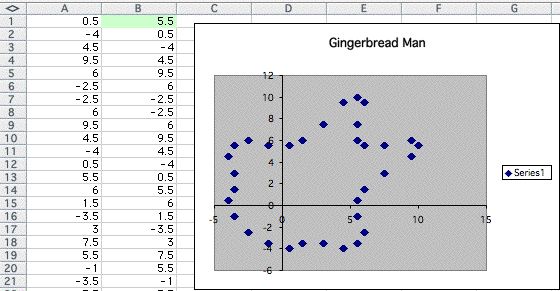
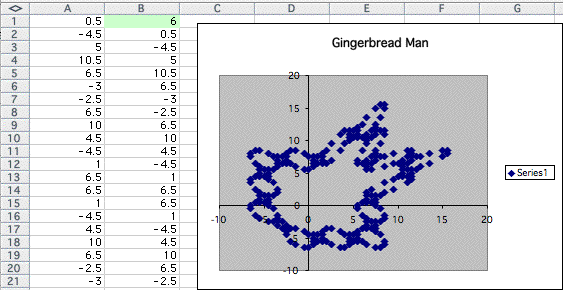
Although the change seems to be different from the graph when we change the value in A1, I found that the graph approaches similar polygon as the number increases. See the example below,
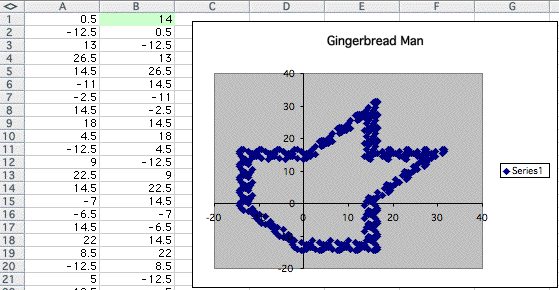
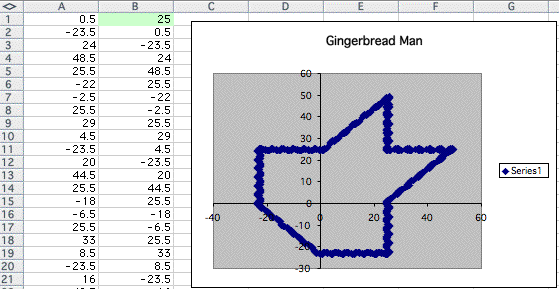
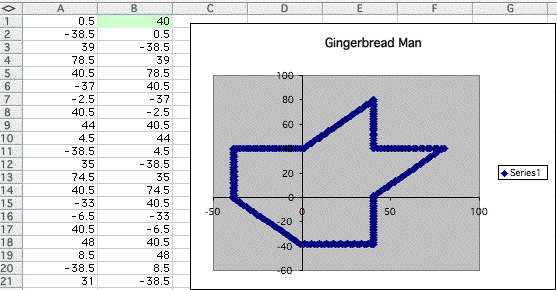
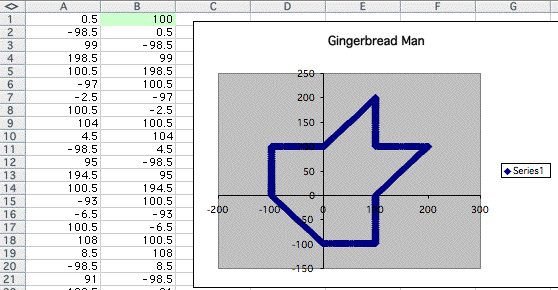
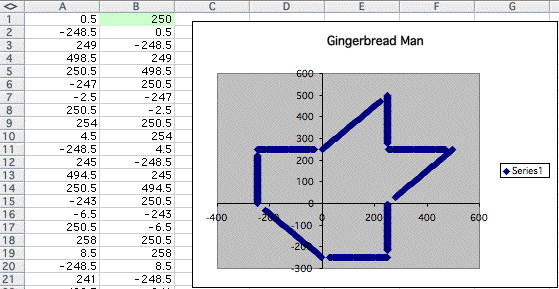
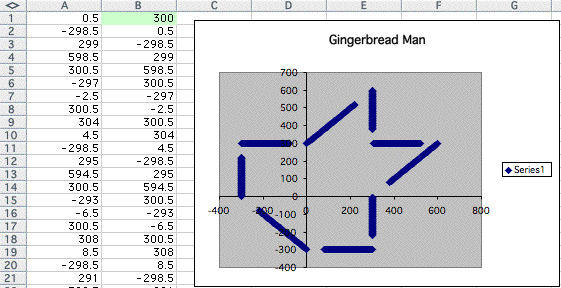
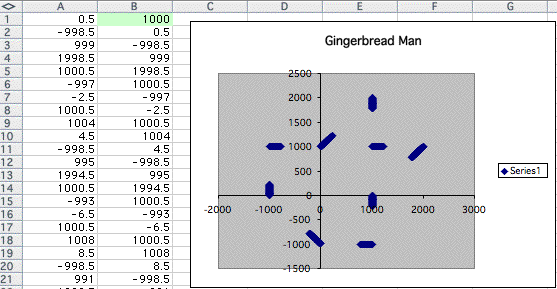
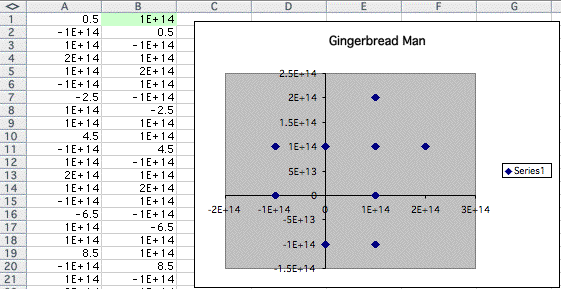
Isn't it interesting?
The shape seems same corresponding to the number I had put in the cell A1.
