
By Brooke Norman
Is it just scribble or does it have
meaning?
Looking at
the graphs of sine and cosine can sometimes just look like wavy lines that have
no meaning. Let’s take a more in
depth look to see what all this scribble is about.
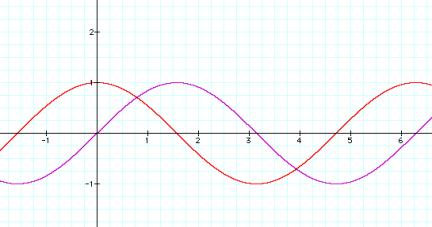
Let’s take
a look at the graph of the equations: y=sin(x)
and y= cos(x). Look to see where they cross the x- and y-axis.
Now let’s
look at the equations of y= a cos(bx+c) and y=a sin(bx+c), and look at
different values of a, b, and c.
For each
graph, we are going to see what is happening as the graphs cross the x- and y-
axis and what the minimum and maximum values for w and y are. This means, what changes are occurring
due to the value changes of a, b, and c.
Let’s look
at the sine graph first.
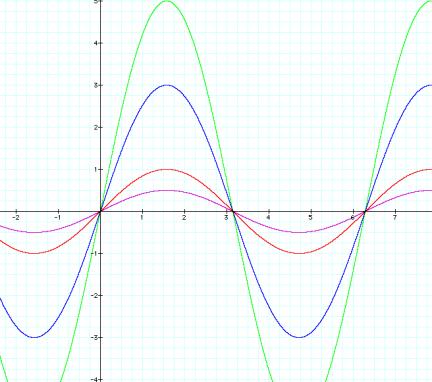
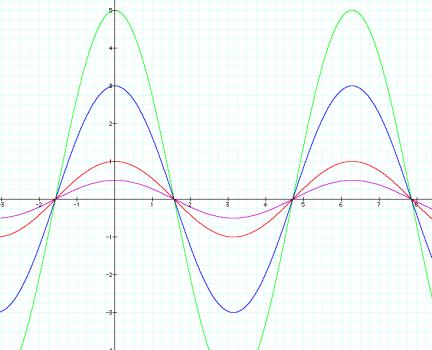
Here we are going to look at the graph as the value of ‘a’
is changed, letting b=1 and c=0.
Purple: y=1/2 sin(x)
Red: y= sin(x)
Blue: y= 3 sin(x)
Green: y = 5 sin(x)
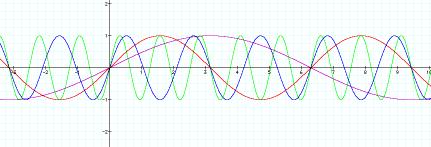
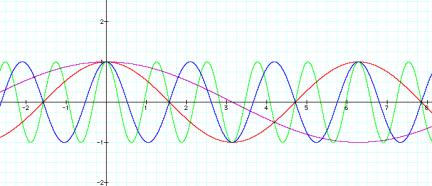
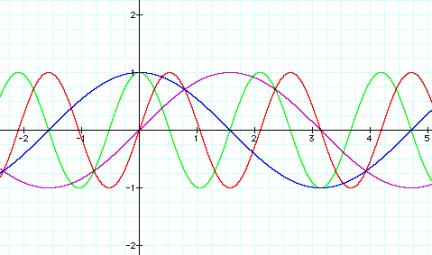
Here we are going to look at the graph as the value of ‘b’
is changed, letting a=1 and c=0.
Purple: y=sin(1/2 x)
Red: y=sin(x)
Blue: y=sin(3x)
Green: y= sin (5x)
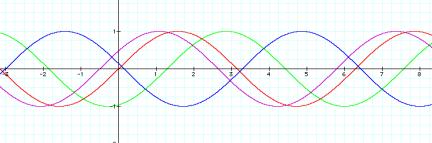
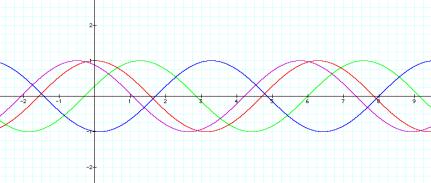
Here we are going to look at the graph as the value of ‘c’
is changed, letting a=1 and b=1.
Purple: y=sin(x)
Red: y=sin(x+1/2)
Blue: y=sin(x+3)
Green: y=sin(x+5)
Now, let’s look at the cosine graph.
Here we are going to look at the graph as the value of ‘a’
is changed, letting b=1 and c=0.
Purple: y=1/2 cos(x)
Red: y= cos(x)
Blue:y= 3 cos(x)
Green: y = 5 cos(x)
Here we are going to look at the graph as the value of ‘b’
is changed, letting a=1 and c=0.
Purple: y=cos(1/2 x)
Red: y=cos(x)
Blue: y=cos(3x)
Green: y= cos (5x)
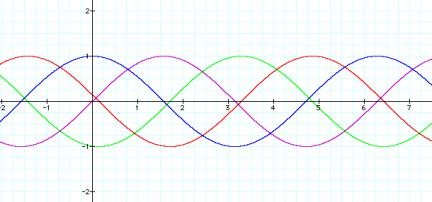
Here we are going to look at the graph as the value of ‘c’
is changed, letting a=1 and b=1.
Purple: y=cos(x)
Red: y=cos(x+1/2)
Blue: y=cos(x+3)
Green: y=cos(x+5)
Let’s combine the graphs of asin(bx+c) and acos(bx+c).
Here is both of them when we vary ‘a’
Y=asin(x) and y=acos(x)
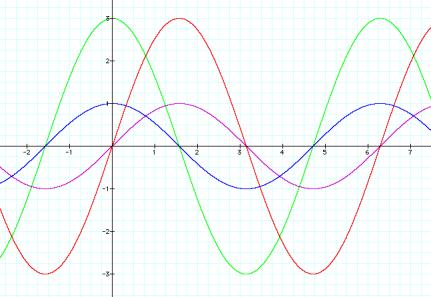
Purple: y=sin(x)
Red: y=3sin(x)
Blue: y=cos(x)
Green: y= 3cos(x)
Here is both of them when we vary ‘b’
Y=sin(bx) and y=cos(bx)
Purple: y=sin(x)
Red: y= sin(3x)
Blue: y=cos(x)
Green: y=cos(3x)
Here is both of them when we vary ‘c’
Y=sin(x+c) and y=cos(x+c)
Purple: y=sin(x)
Red: y=sin(x+3)
Blue: y= cos(x)
Green: y=cos (x+3)
Here is what all the graphs look
like when they are combined?
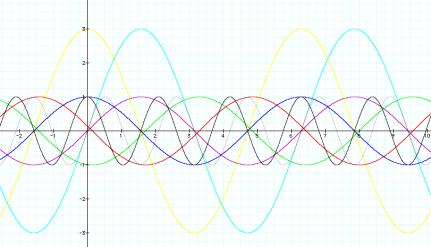
I guess it’s more than scribble, huh?
Return
to Brooke's EMAT 6690 homepage