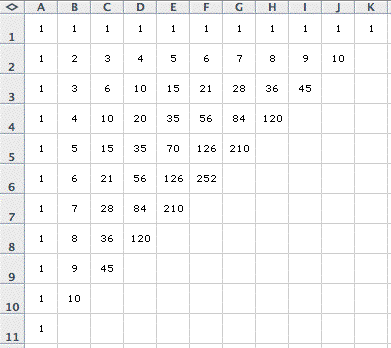
We can use a spreadsheet in Microsoft Excel to quickly and easily generate Pascal's triangle. We know that 1 is along the 0th diagonal. Here the 0th diagonal is actually COLUMN A. Then, along the nth diagonal our entry will also be 1. This diagonal is represented along ROW 1. In Microsoft Excel, Pascal's triangle has been rotated in order to fit with the given rows and columns.
The remaining entries can be expressed by a simple formula. We know that an entry in Pascal's triangle is the sum of two entries in the preceding row. In Excel terms, 2 (cell B2) is equal to 1 (cell A2) plus 1 (cell B1). So, the formula we would enter into B2 would be "=A2+B1". Similarly, the same formula can be applied to all remaining cells of our triangle. Fortunately, once the formula has been entered into Excel, we can simply drag the box onto other cells and the remaining entries are automatically computed for us.
The image below is of the first 10 rows of Pascal's triangle in Microsoft Excel. Notice how the cell row heights and column widths have been adjusted to appear equal. This gives our values a triangular shape, and it is easier to see Pascal's triangle.
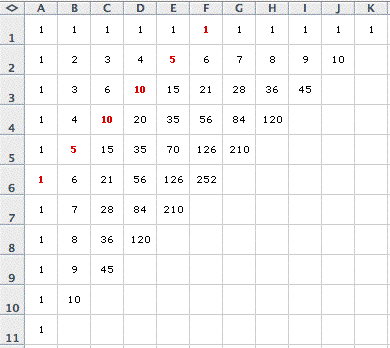
Each row of Pascal's triangle does not directly relate to the row values given in Excel. For example, row 5 of Pascal's triangle has been highlighted in red, but notice that the values do not all appear in row 5 of Excel.
For the following explorations, the row number used will refer to Pascal's triangle. Microsoft Excel is simply a tool for us to investigate modular arithmetic and Pascal's triangle, and so Excel row numbers and column letters will not be necessary.
Click here to see the Excel file used to generate each of these triangles and modular explorations.
Return
to Essay 1: Pascal's Triangle and Modular Exploration