

The graphs of quadratic functions of the form as the one below is investigated in this assignment.

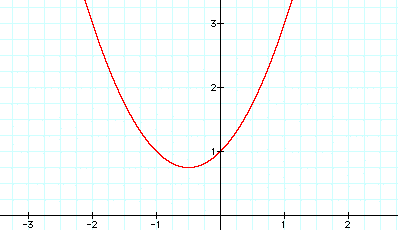
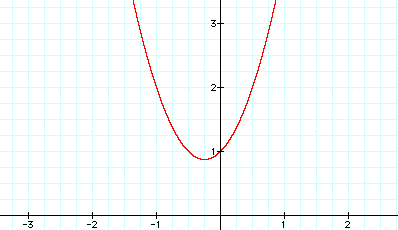

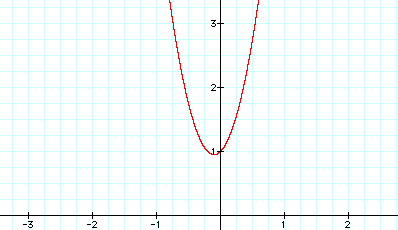
As can be seen from the three graphs above, when the value of a is increased the graph of the curve narrows.
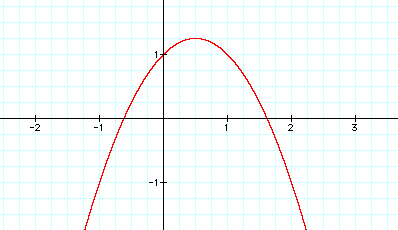

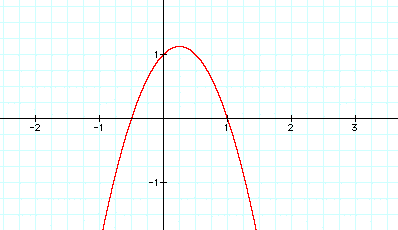

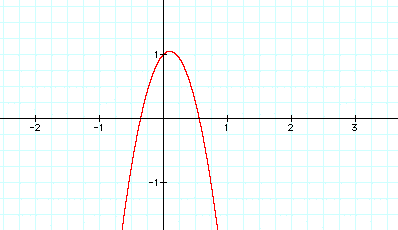
And when a is a negative number, the graph of the curve opens downward and narrows as the absolute value of the negative increases.
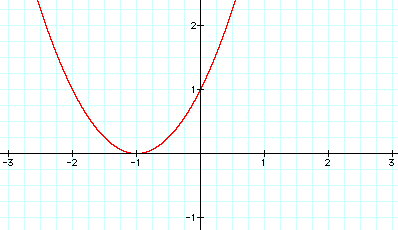
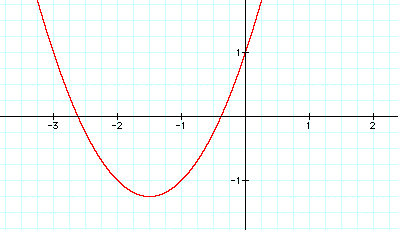
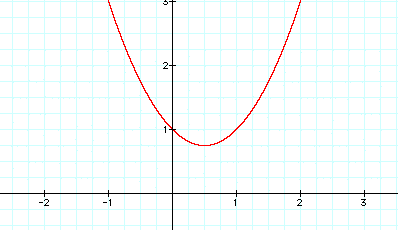
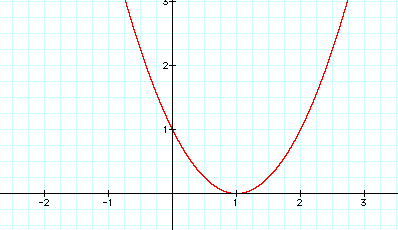
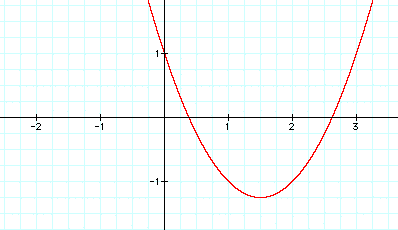
When b is positive and increasing the graph of the curve shifts in a circular motion from right to left. When b is negative and decreasing, the graph of the curve shifts in a circular motion from left to right.
This is graph of 5 parabolas with a and b held constant and c varying.


As c varies, the graph of the parabola is shifted along the y axis.
The graphical representation of the quadratic equation can help in analyzing the roots of the equation. The points on the intersection of the curve with the x-axis determine the zeroes of the function--which are the roots when the roots are real. When the curve is tangent to the x-axis, a double root occurs. And, when quadratic equation has no point on the x-axis, the roots are imaginary.
Click here to see the animation.