
Now and Then: Postage Stamp Price Analysis
by Arielle Alford
Since the early twentieth century, the price of first-class postage has been on the rise. Our task is to analyze the trend in postage rate in order to predict what the price of a stamp will be in the future. First, we should look at the following data showing the price of a stamp during the last century.
|
Year |
Stamp Cost (cents) |
|
1919 |
2 |
|
1932 |
3 |
|
1958 |
4 |
|
1963 |
5 |
|
1968 |
6 |
|
1971 |
8 |
|
1974 |
10 |
|
1975 |
13 |
|
1978 |
15 |
|
1981 |
18 |
|
1982 |
20 |
|
1985 |
22 |
|
1988 |
25 |
|
1991 |
29 |
|
1995 |
32 |
|
1999 |
33 |
|
2001 |
34 |
|
2002 |
37 |
|
2006 |
39 |
By plotting these data we can better see trends in the price of a stamp.
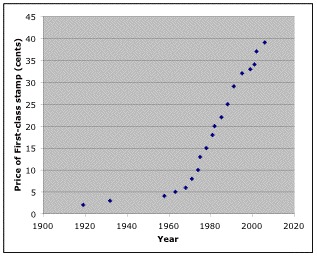
Though one might expect roughly linear growth in stamp price over time, the graph of our data reveal a very different trend. In the early part of the 20th century, cost grew relatively slowly (about 3 cents in 40 years). However, during the last 50 years the increase in price appears much more rapid. What general function do you think might describe this pattern of growth?
In fact, these data could be modeled with an exponential curve, since an exponential graph initially increases slowly and over time increases more rapidly. Recall that an exponential function looks like the following:
![]()
where the coefficients c and n are real numbers.
We find that the following function seems to be a fairly good representation of our data:
![]()
Below is the graph of the data as well as this function. Compare the data points predicted by the function to the actual stamp data points. Are they close?
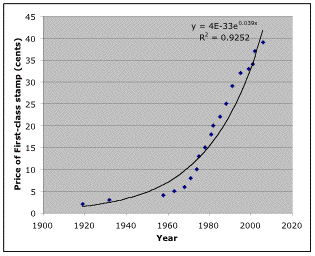
During some years, the price growth seems to be a bit slower than our function predicts (e.g. 1959 to 1970) while sometimes growth was more rapid than predicted (e.g. 1980 to 1998). But overall, this function seems to do a pretty good job representing our data set.
Now we can use this function to predict the stamp price in the future. Check it out below.
|
Year |
Actual Price |
Predicted Price |
|
1999 |
33 |
35 |
|
2001 |
34 |
38 |
|
2002 |
37 |
40 |
|
2006 |
39 |
46 |
|
2008 |
? |
50 |
|
2010 |
? |
54 |
|
2012 |
? |
59 |
|
2014 |
? |
63 |
|
2016 |
? |
68 |
|
2018 |
? |
74 |
|
2020 |
? |
80 |
|
2022 |
? |
87 |
|
2024 |
? |
94 |
|
2026 |
? |
101 |
|
2028 |
? |
109 |
When does our function predict that the price of a stamp will be $1? What year will the cost of a stamp be twice the price in 2006 (i.e. when is the predicted price 2x39=78)?
Analysis of stamp data in 1996 revealed that the price of a stamp seems to double every 10 years. Does the prediction function we found using stamp price up to 2006 seem to support this doubling theory? Let’s see . . .
From our function we know that the price at any time, x, will be
![]()
Now imagine that at some time, m, the price of a stamp is y cents. Then at some later time (we’ll call it n) the price of a stamp is now twice the price at time n (that is, the price is 2y). So we can use the following equations to describe this situation.
![]()
Check out what happens if we multiply our first equation by 2.
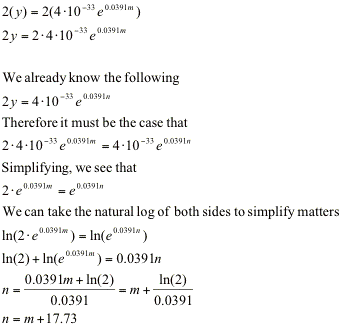
So this tells us that the time n (when the price has doubled) is 17.73 years later than m. Our function indicates that the doubling time is not 10 years, but 17.73 years. Does this seem to fit the predicted values in the table above?
The data we used to analyze stamp price was not adjusted for inflation. If we took inflation into account, do you think that the relative price of a stamp has increased, decreased, or stayed constant over the past 100 years? Something to consider . . .