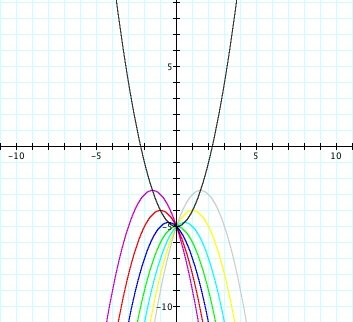
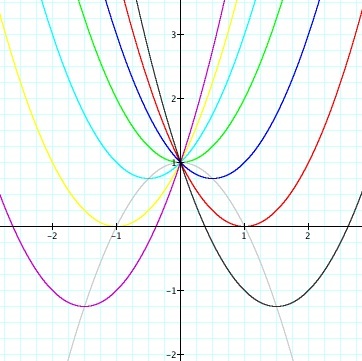
Let y =
ax² + x + 1. The following picture shows the graphs of this
function when a = -3, -2, -1, 0, 1, 2, 3.
Assignment
3
This activity explores of the equation
ax² + bx + c = 0, and the effect different values of a, b, and c
on its roots.
In all cases, the
graph intersects the y axis at y = 1. When a > 0, this
function has no real roots. When a < 0, however, the function
has two real roots. If we imagine the parabola starting at a = 0,
then as the value of a increases, the parabola gets narrower and
narrower in an upward opening direction. Since these parabolas
will never cross the x-axis, they have no real roots. If we again
imagine starting at a = 0, or a straight line, then as the value of a
decreases, the parabola becomes narrower and narrower in a downward
facing direction. These parabolas will always cross the x axis,
and will therefore always have two real roots.
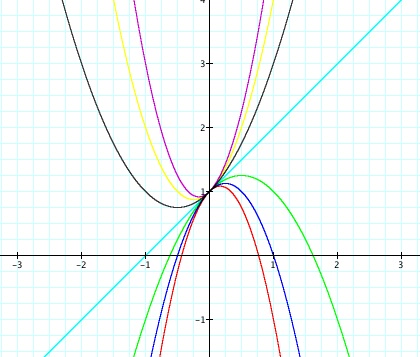
Again, these graphs
all intersect the y axis at y = 1. Changing the value of b seems to
have two impacts. 1) As the value of b falls further and further from
the x axis, the minimum of the function becomes increasingly
smaller. 2) As b becomes increasingly more positive,
the minimum of y becomes increasingly negative, relative to the x
axis. As b becomes increasingly negative, the minimum of y
becomes increasingly more positive, relative to the y axis. When
|b| = 2, the function will have one real root. When b < -2,
the function will have two real negative roots. When b > 2,
the function will have two real positive roots. When -2 < b
< 2, the function will have no real roots.
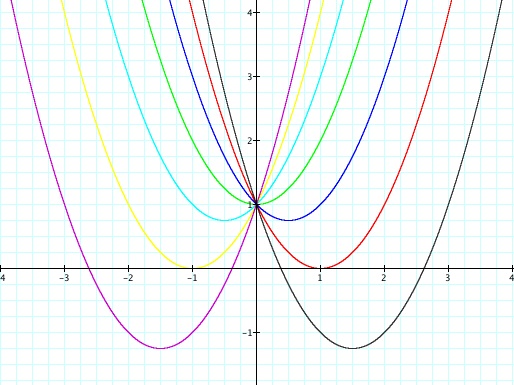
Finally, let's look at the function y = x² - x + c. The
following picture shows the graphs of this function when c = -3,
-2, -1, 0, 1, 2, 3.
In this graph, notice that
every parabola is symmetric about the line x = 1. In fact, the
set of all vertices of this parabola, where c is a real number, would
be the line x = 1. When c = 0 or c > 0, this function has two
real roots, one negative and one positive. When c < 0, this
function has no real roots.
Now consider the locus of the vertices of the set of parabolas
graphed from y = x² + bx + 1. Notice that
the graph of this set of vertices is the parabola y
= -x² + 1 (shown in light gray).
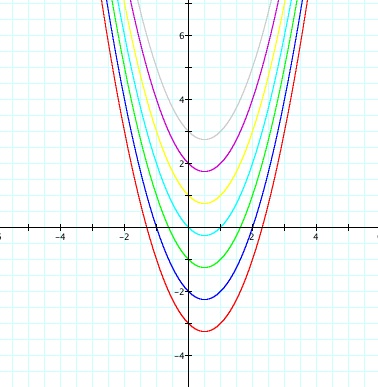
Let's look at
one more case like this. Consider the function y = -x² + bx
- 5, where b = -3, -2, -1, 0, 1, 2, 3.