
Cycloid Problem
First, I need to thank Eileen Murray and Arielle Alford for helping me with this problem. I came into this problem with little parametric equation understanding. With their help and a lot of fiddling on Graphing Calculator, I figured the problem out to the best of my ability.
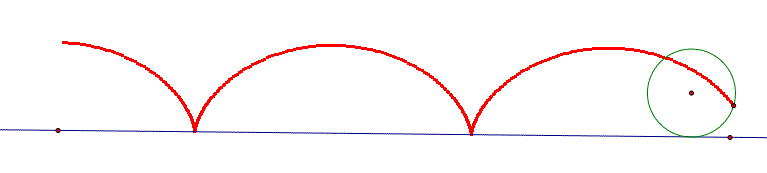
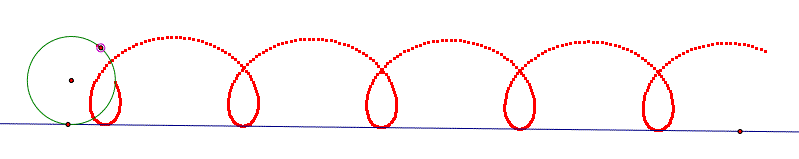
This problem challenged me to use GSP and Graphing Calculator to find the parametric equations for a cycloid. A cycloid is the locus of a point on a circle that is rolling along a line. Think of watching a spot on a wheel of a car as it drives by. If you could trace that spot what would it look like? Click here to open up a GSP file that has this setup for you.
Here is a picture of what is happening:
Since the graph is periodic, I knew I needed to use the sine and/or cosine curves. My first guess was that I was looking at the top half of an ellipse. However, I don't know how to make an ellipse repeat, so I had to drop this idea.
After guessing and checking on Graphing Calculator, I decided to use x = sint + t and y = cost +1.
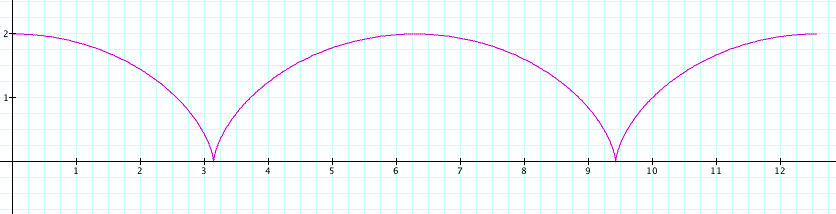
This works when the diameter of the circle is 2. As you can see that's the highest point of the graph and it correlates with the diameter of the circle. So my first question is what if I want to change the diameter to 3?
Again, after some time experimenting with the above equations, I discovered that the range of the graph is related to the diameter through the coefficient of cost and the number being added on to cost. More specifically, the coefficient and number being added need to both equal the diameter divided by 2.
So the equation for y is the
following where d = diameter: 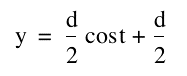 . To
answer my question, I need to plug in d = 3 and leave the x equation
alone to get a diameter of 3.
. To
answer my question, I need to plug in d = 3 and leave the x equation
alone to get a diameter of 3.
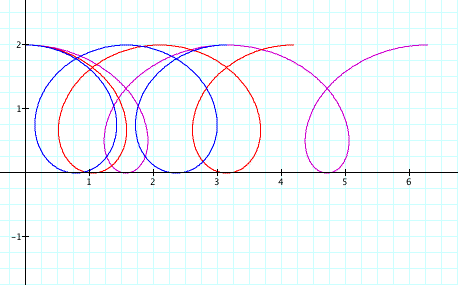
Next, I decided to determine what is going on with the x equation. How is it impacting the graph? I decided to put a coefficient in for sint that is greater than 1. This is what I got:
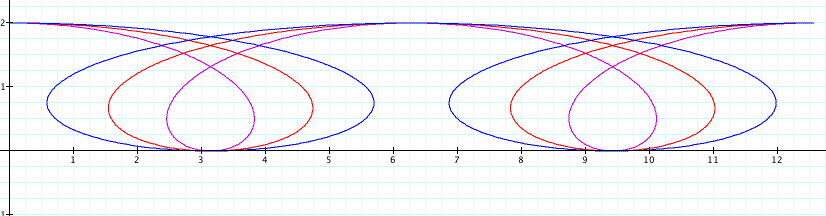
The purple graph is coefficient of 2, the red is coefficient of 3, and the blue is 4. So it appears the coefficient of sint effects the loop size. If I use coefficients less than 1, I do not get loops. Instead it seems to effect the steepness of the curve.
Here the purple graph is coefficient of 1/2, the red is coefficient of 1/3, and the blue is 1/4.
Where are these loops coming from? If we go back to the GSP file and open the motion controller, we can see how these loops are formed. If the speed of the rotating point is faster than the speed of the point moving forward, we get these loops. That means the wheel is spinning faster than the speed of the car moving forward.
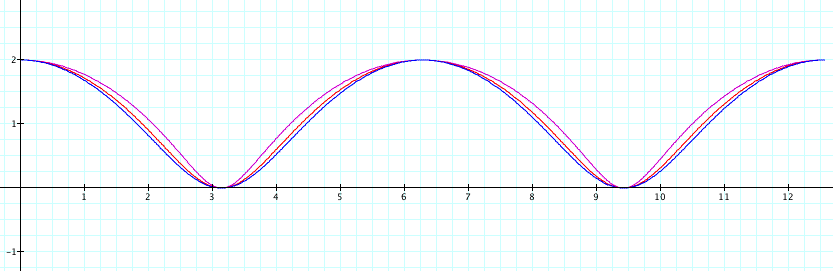
Next, I decided to experiment with the plus t part of the x equation. What if I used a coefficient?
This is what Graphing Calculator produces. As you can see, it seems to stretch the graph along the x axis. This makes sense because it is the x equation we are messing with! So what if I use numbers less than 1?
This not only seems to shrink the graph along the x-axis but it appears to add loops in it! So what if I put a coefficient back in front of sint and one in front of t?
It appears as though this isn't as confusing as I thought! When the coefficients are equal we get the green graph. It looks a lot like our original graph just shorter (the coefficients were 1/2). I just varied the coefficient in front of t and you can see that when it is less than 1/2 the graph shrinks along the x (blue graph) and adds loops. When the coefficients are greater than 1/2, the graph stretches horizontally (purple, red, and blue graphs) and has no loops.
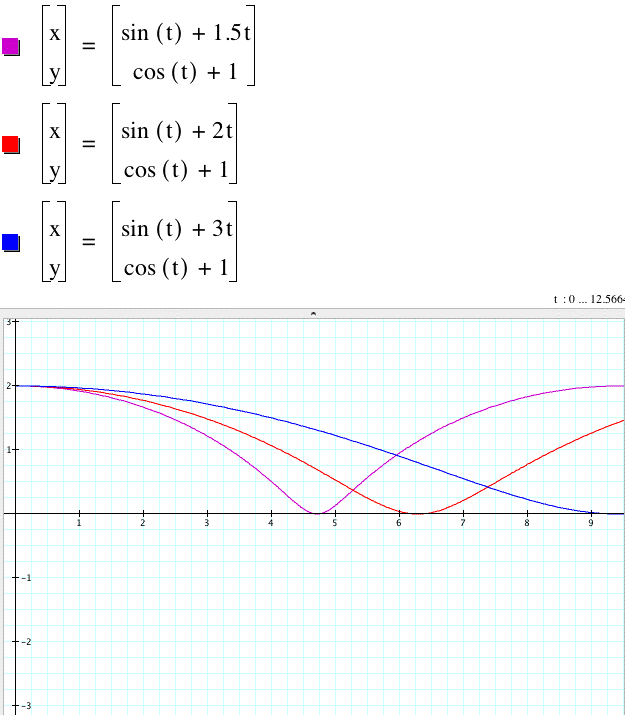
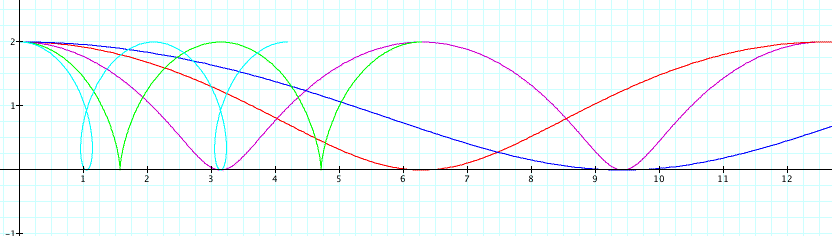
When I use a coefficient of 2 in front of sint and vary the coefficient of t, this is what I get:
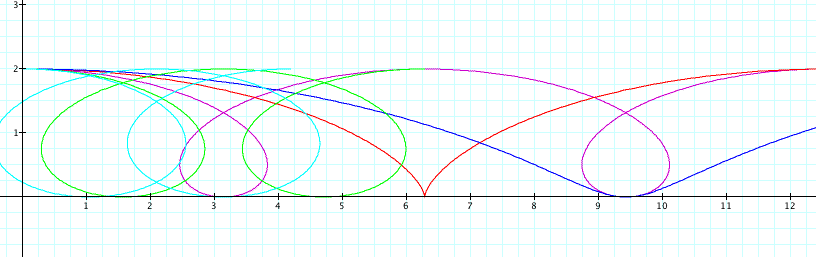
As you can see, when the two coefficients are equal you get the red graph. When the coefficient of t is less than 2 you get the light blue, green, and purple graphs. The loop sizes appear to be changing. The dark blue graph is when the coefficient of t is 3. It eliminates the loops.
So let's see if we can generalize what I've found so far. Let's let our equations be
x = a sint + b
y = d cost + d
d = the diameter divided by two. It controls the height of the graph and makes sure that it stays on the x-axis.
a = loop size.
b = stretch/shrink
If a = b, then there are no loops. If a > b, then there are loops. The bigger the difference between a and b, the bigger the loops. If a < b, then the loops disappear.