
EMAT
6680 Assignment 1

Victor
L. Brunaud-Vega
For each of the following
items, I used the Graphing Calculator 3.5 program, to explore, understand, and
extend.
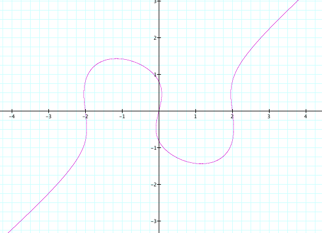
1. Examine:
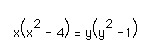
What happens if the 4 is
replaced by other numbers (not necessarily integers)? Try 5, 3, 2, 1, 1.1, 0.9,
-3. Any unusual event? Interpret.
|
|
Let us rename the
constant 4 as “n”. Then, we have: x (x2 - n) = y (y2
- 1) Using the
software “Graphing Calculator” I made this animation, where we can
see that, when n=1, it appears an oval crossed by its center for a straight
line. |
|
|
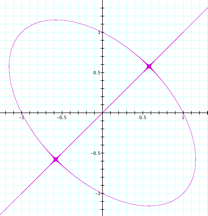
What equation would give the following graph?:
|
||
|
I
started using the original equation x (x2 - 4) = y (y2
- 1) because
it looks more symmetric. As a
consequence of the previous exploration I knew that “n” wouldn’t help in this
case, so I had to break the symmetry in a different way. Adding a constant to the first term,
I found that x (x2 - 4) + (-2.1) = y
(y2 - 1) gives
me something similar to the original picture, as you can see. My
question now is: May I find the same graphic adding a constant in the second
term of our original equation?
Of course, it is only a thing of adding 2.1 to the second term and we
have the same graphic. |
|
|
|
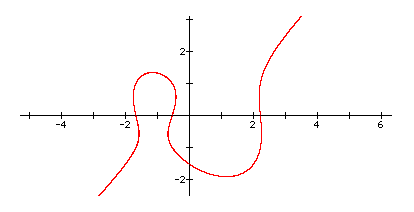
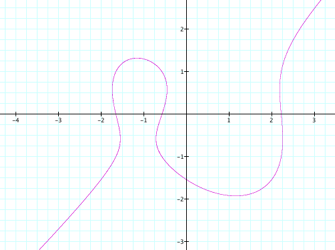
Actually,
there is a group of values that produce similar graphics. If you are adding a constant to the
first term of the equation, then you can produce a similar graphic using one
of the values between -1.6 and -2.3, as you can see in this
animation; the same effect is produced if you add a constant with value
between 1.6 and 2.3 to the second term of the equation, as you can see in this
animation.. |
||
|
|
|
|
|
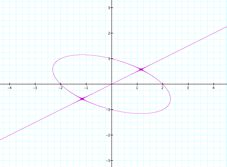
What happens if a
constant is added to one side of the equation? |
||
|
First,
I tried with a constant on the right side as
And
the graphic shows a straight line passing by the origin of the system (0,0)
and projecting itself through the first and third quadrants, crossing an
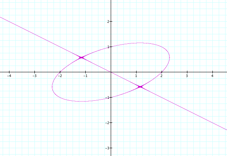
oval, centered in the origin, when the constant has a value of 8. Now, what happens
if I make n = -8 ?
Then we have a graphic showing a straight line passing by the origin
of the system (0,0) and projecting itself through the second and fourth quadrants,
crossing an oval centered in the origin. |
|
|
|
n = 8 |
n = -8 |
|
|
|
|
|
|
Let
us try a different variation of the given formula, using a constant:
In
this case, it is produced a straight line crossing the origin of the system
(0,0) and having a nice behavior, because whatever is the locus of the line
in the first and fourth quadrants, exactly the opposite is the behavior of
the line in the second and third quadrants. |
|
|
|
|
|
|
|
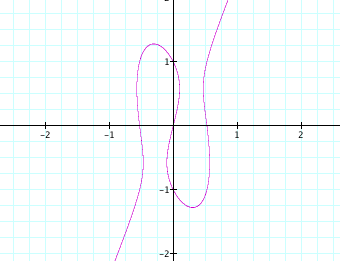
Now
is time to try these variations in the first term of the given equation. Then, we begin multiplying the factor
x by the constant n, so:
Again
we have the straight line crossing the origin and the oval centered in the
origin, although this time the value of n = -0.13 or n = 0.13 Here
is an animation to watch the situation. |
n = 0.13 |
n = -0.13 |
|
Then we try the
other variation:
The result, as at
the beginning a straight line crossing the origin of the system (0,0) and
having a nice behavior, because whatever is the locus of the line in the
first and fourth quadrants, exactly the opposite is the behavior of the line
in the second and third quadrants. |
|
|
|
|
|
|
|
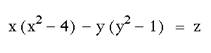
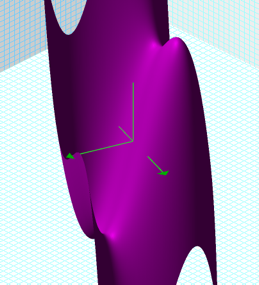
Try
graphing
Funny,
hah? See the graph here. Well
obviously z represents a third dimension. Now, what happen if I try a variation in the first term of
this equation? Here
are some animations to explore those situations: |
|
|
|
|
||


![]() Return to my Class
Page
Return to my Class
Page
![]() Return to EMAT 6680 Home Page.
Return to EMAT 6680 Home Page.