EMAT 6680 Assignment 1
Problems and
explorations with second degree equations

by
Victor L. Brunaud-Vega
After exploring all of Assignment 2, I selected some for this Write-up.
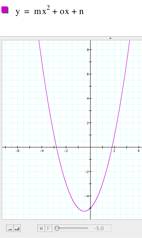
1. Construct graphs for the parabola y=ax2+bx+c for different values of a, b, and c.
(a, b, c can be any rational numbers).
|
|
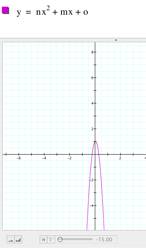
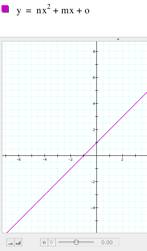
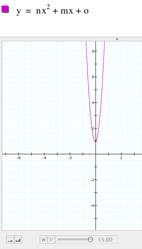
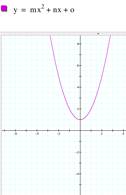
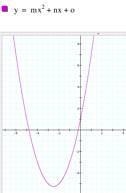
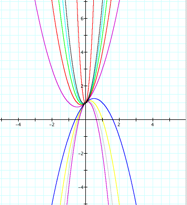
a) Trying different values for a. Keeping b=1 and c=1, I tried
different values for a. It gave me a parabola crossing the y
axis at (0,1) and, if the value of a=0, then the line becomes straight and crossing the x axis at point (-1,0). If the value of a is negative, then the parabola opens downwards. If the value of a is positive, then the parabola opens upwards. |
||||||
|
|
|
||||||
|
|
Here
is an animation showing the behavior of the line as the value of a changes. |
||||||
|
|
|
|
|||||
|
|
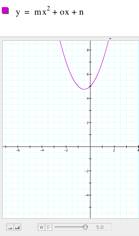
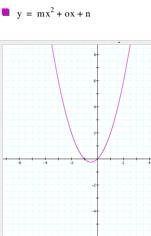
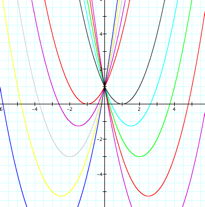
b) Trying different values for b. Keeping a=1 and c=1, now I
tried different values for b. The result was a
parabola moving through all the four quadrants but crossing the y axis only
at the point (0,1). It looks
like b controls
the location of the axis of symmetry. |
||||||
|
|
|
||||||
|
|
Here
is an animation to watch the effect of changing the value of b. |
||||||
|
|
|
|
|||||
|
|
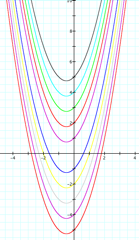
c) Trying different values for c, Keeping a=1 and b=1, it is
time to try different values for c. Now the result was a
parabola going up and down, crossing the y axis in several points. The parabola crosses the origin of the
system (0,0) when c=0. And, if c = 1, then the parabola crosses the y
axis at point (0,1). It looks
like c controls
the point where the parabola crosses the y axis. |
||||||
|
|
|
||||||
|
|
Here
is an animation to watch the effect of changing the value of c. |
||||||
|
|
|
|
|||||
|
|
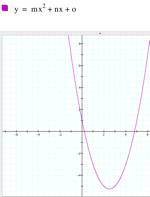
d) Trying different values for a and b. What happens if we change the values of two
parameters? Changing a and b we know that the parabola will cross the y axis only at the point
(0,1) because that is the parameter represented with c. Apparently, the parameter c controls the point where the parabola
crosses the y axis and b controls
the location of the axis of symmetry. In the pictures below there are graphics for
different values of a, b, and c respectively. |
||||||
|
|
|
|
|
|
|
||
|
|
|
|
|||||