
The data used in this investigation is updated version of the data used in Assignment 12. It includes the price increases for a first class letter through January 2006 when the price will become 39 cents.
Here is the updated data:

The data is plotted using Excel. The graph is the following:

I use the exponential model to develop a prediction function:

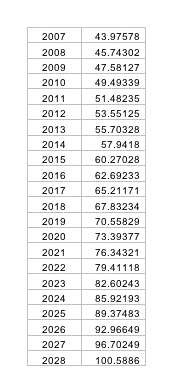
Using this function, the prices for coming years are predicted as follows:

According to this data, the price will be 74 cents in 2020 and 100 cents in 2028.
This time, I decided to use the exponential model after omitting some data. The prices for years 1919 and 1932 seemed to create a problem.
So, I used the following data:

The actual graph and the graph of the exponential model looked like this:

This seemed to be a better model upto year 1997 but then grew much faster than our given data.


Again, it is possible to try our models and try to find the best fit depending on criteria that we have.