Assignment 10: Exploring Parametric Equations by Dorothy
Evans
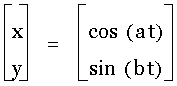
A parametric curve in the plane is a pair of functions
where
the two continuous functions define ordered pairs (x,y). The two
equations are usually called the parametric equations of a curve. The extent of
the curve will depend on the range of t and your work with parametric
equations should pay close attention the range of t . In many applications,
we think of x and y "varying with time t " or
the angle of rotation that some line makes from an initial location.
Let’s
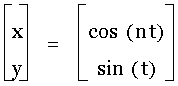
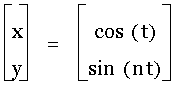
examine the parametric equation
 for 0≤ t ≤ 2¹
For
various a and b.
First
we’ll look at a from 1 to 10, when b is held constant at 1.
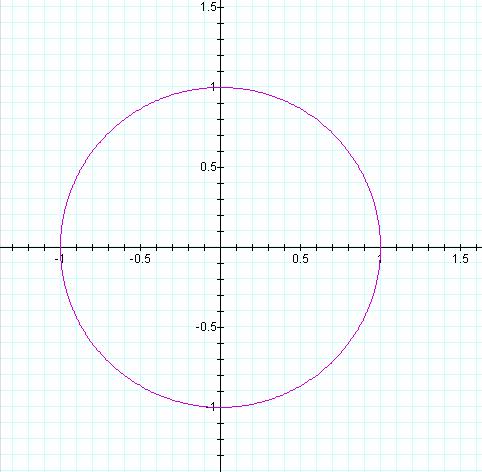
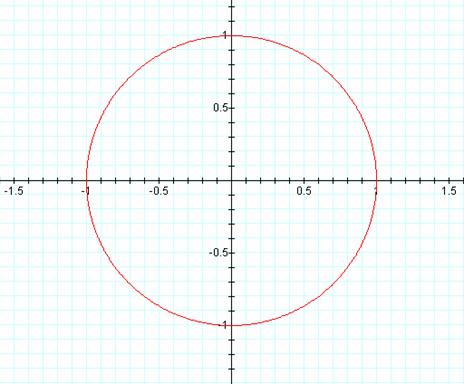
When a =1 and b = 1 the resultant graph is a circle
(below). For those familiar with the sin
and cosine functions it should be apparent that this circle represents the unit
circle we become familiar with in the typical High School Trigonometry
course. It’s also important to note the
parameters for t, in this case since 0≤ t ≤ 2¹ we have included an entire period of each of the sine
and cosine functions and thus the entire unit circle.
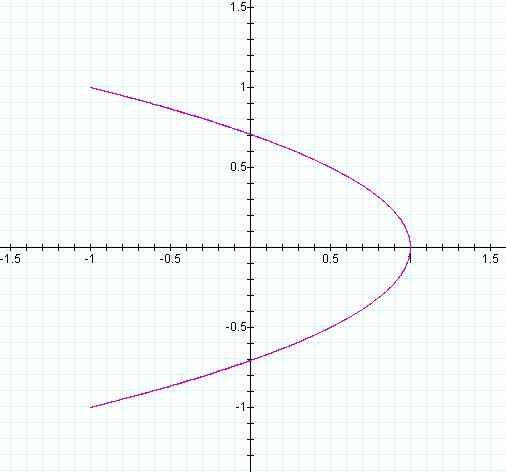
When a=2 and b=1 the graph is entirely different. In this case it appears to be a parabola on it’s side. Can you tell if it’s a real parabola? How would we prove or disprove this theory or do you have another theory?
Here is where a=3 and b=1 (below left). What I noticed in particular as I continued the investigation is 2 things.
#1: When a is odd the graph crosses the y axis exactly 2a times and crosses the x axis 2b times
#2: When a is even the graph crosses the y axis a times and crosses the x axis b times.
Let’s see if this holds true as we continue.
|
Here a is odd and the graph crosses the y axis 6 times or 2a times Also the graph crosses the x axis 2 times or 2b times. |
Here a is 4 and b is 1. A is even and the graph crosses the y axis 4 times or a times Also the graph crosses the x axis 1 time or b times. |
|
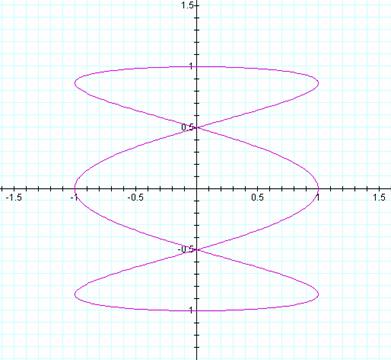
Here a is 5 and b is 1. Here a is odd and the graph crosses the y axis 10 times or 2a times Also the graph crosses the x axis 2 times or 2b times.. |
Here a is 6 and b is 1. A is even and the graph crosses the y axis 6 times or a times Also the graph crosses the x axis 1 time or b times |
|
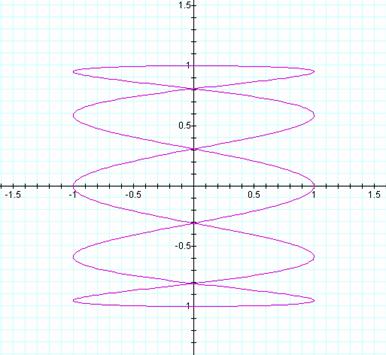
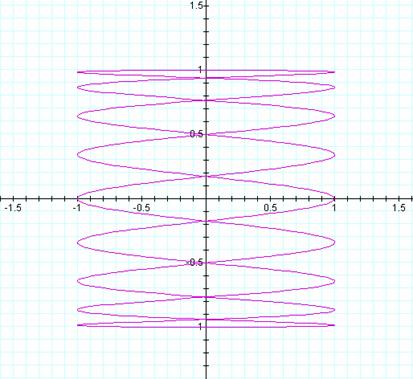
Here a is 7 and b is 1. Here a is odd and the graph crosses the y axis 14 times or 2a times Also the graph crosses the x axis 2 times or 2b times.. |
Here a is 8 and b is 1. A is even and the graph crosses the y axis 8 times or a times Also the graph crosses the x axis 1 time or b times |
 n=10
n=10
|
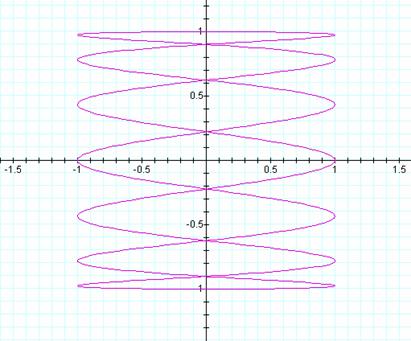
Here a is 9 and b is 1. Here a is odd and the graph crosses the y axis 18 times or 2a times Also the graph crosses the x axis 2 times or 2b times.. |
Here a is 10 and b is 1. A is even and the graph crosses the y axis 10 times or a times Also the graph crosses the x axis 1 time or b times |
Next
we’ll look at b from 1 to 10, when a is held constant at 1 and contrast this
graph with the ones above where a is from 1 to 10 and b is held constant at
1. The purple
graphs are where a is changing and the red graph is where b is changing.
|
Purple Graph
|
Red Graph
|
|
b = 1 and a = 1 Here you don’t see the purple graph because the red one is on top. Since the graph is symmetrical the two overlay each other. |
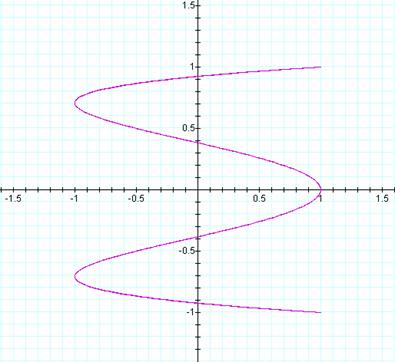
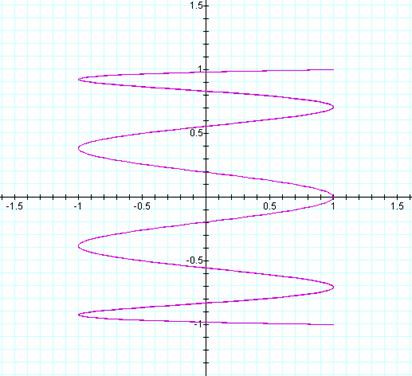
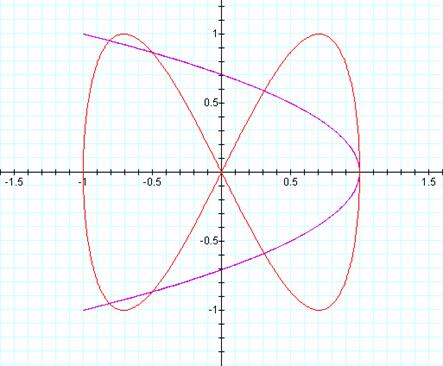
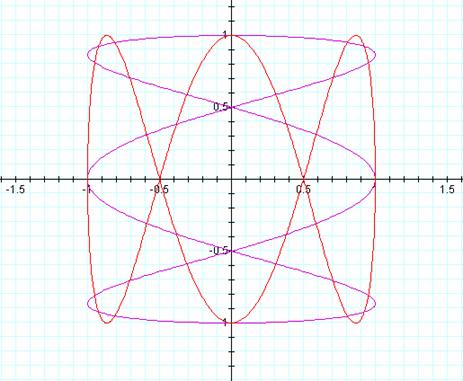
a = 2, b = 1 b = 2, a = 1. In this graph the difference in the two graphs becomes evident. Notice the difference in the pattern from before. In this case the red graph crosses the x axis 2b times and the y axis 2a times. Maybe our even and odd cases will flip flop. Let’s see….. |
|
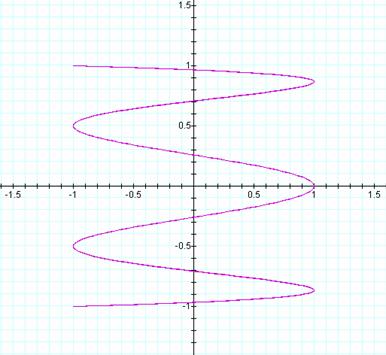
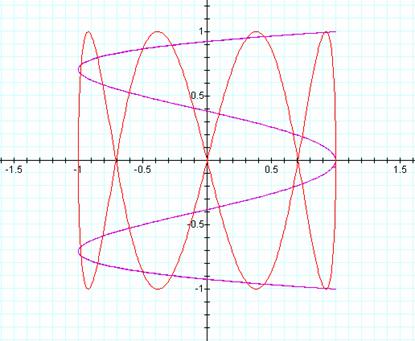
a = 3, b = 1 b = 3, a = 1. Here the red graph crosses the x axis 2b times and the y axis 2a times. Now did the conditions flip? Doesn’t look so. In these cases both the even and odd values cross the x axis 2b times and y axis 2a times. Let’s look at a few more. |
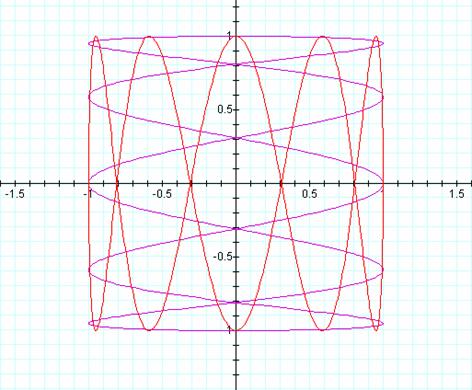
a = 4, b = 1 b = 4, a = 1. Here the red graph crosses the x axis 2b times and the y axis 2a times. |
|
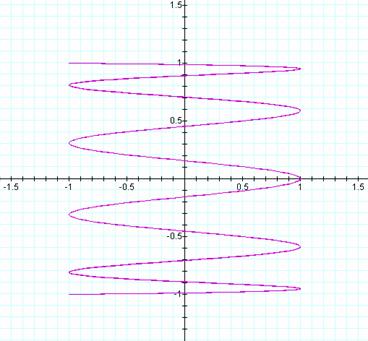
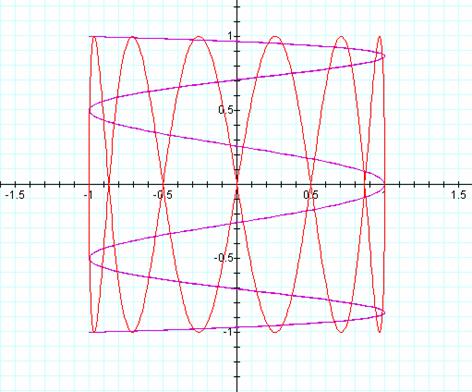
a = 5, b = 1 b = 5, a = 1. Here the red graph crosses the x axis 2b times and the y axis 2a times. |
a = 6, b = 1 b = 6, a = 1. Again, the red graph crosses the x axis 2b times and the y axis 2a times. |
Next we could look at where
a>b, but I’d like to see what you find in these cases.
To investigate further click
here for the graphing calculator
file. Happy exploring!