Assignment 11: Polar Equations
By Dorothy Evans
Let’s investigate the polar
equations below
|
Purple |
|
|
Red |
|
|
|
|
|
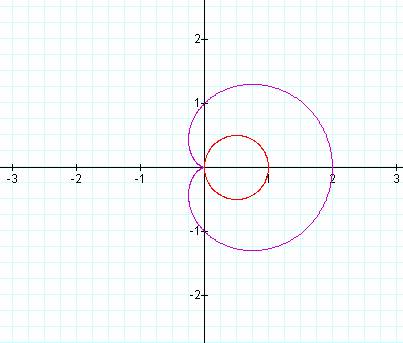
Here is the first case
where a = 1, b = 1, and k = 1. As you
can see it’s ok, but let’s see when we change k. |
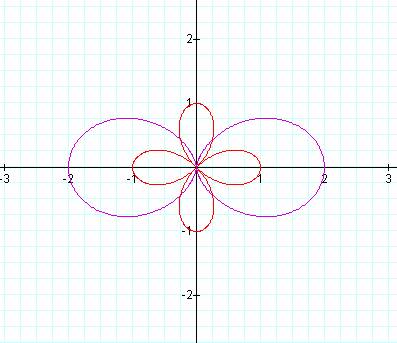
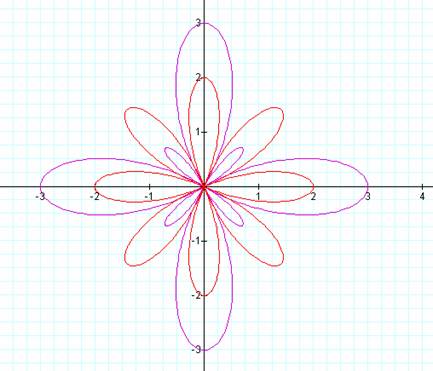
Here a = 1, b = 1, and k = 2. As you can see a flower like shape emerges. Notice the length of the red petals are 1 and the length of the purple are 2. Also notice the number of petals. At this point there are 4 red petals and 2 purple. Let’s see what happens next. |
|
|
|
|
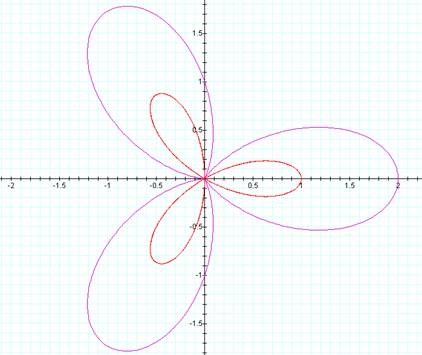
Now a = 1, b = 1, and k =
3. Notice the shape now has 3 petals
that are still 1 long in the red and 2 long in the purple. So what do you think k changes? Let’s try another. |
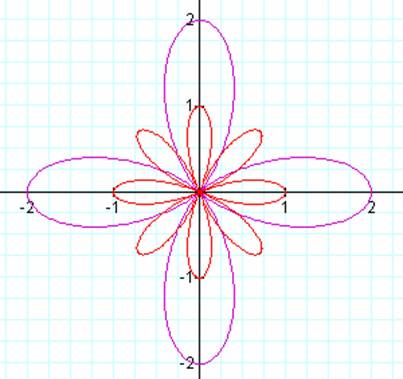
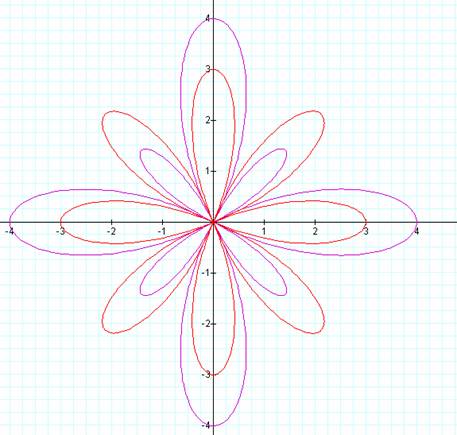
Here a = 1, b = 1, and k =
4. It would appear when k is even we
get 2k petals in the red graph and k petals in the purple graph. Now let’s see what happens as we change a. |
|
|
|
|
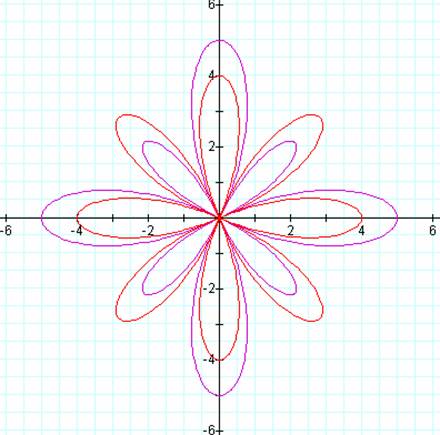
In this case a = 1, b = 2,
and k = 4. So, it would appear we now
have 2k petals in both the red and purple, but in the purple graph the petals
are different sizes. In the red graph
the petals are b long and in the purple graph the petals are k-a and a in
length. |
In this case a = 1, b = 3,
and k = 4. The flower got bigger. Notice the larger purple petals are 4. So maybe the length of the larger purple leaves
is actually a+b instead of k-a. Also
it appears the red are still b in length and the smaller purple petals are
not a, but b-a in length. Let’s try
another and see if our equations hold true. |
|
|
|
|
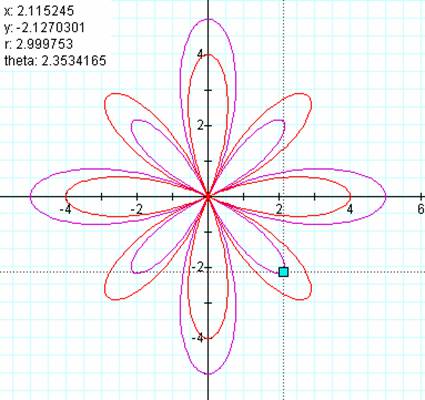
Now a = 1, b = 4, and k =
4. From our previous investigation we
hypothesized: # of petals: 2k Size of red petals = b =
4 true Size of larger purple
petals = a+b = 1+4 = 5 true Size of smaller purple
petals = b – a = 4-1 = 3 true |
Looks like we got the
pattern figured out. Now for those of
you wondering how I verified the length of the smaller purple petals because
none of them are on an axis. It’s
simple, the good old Pythagorean Theorem.
I took an estimate of my (x,y) coordinates and calculated the distance
to the origin. Now in this case I used
an approximation. How would you prove
it? For that matter how would you
prove any of the distances we hypothesized? |
To explore these graphs further click here for the Graphing Calculator file.