
Parametric Equations
By
Jeffrey R. Frye
In this assignment, I explored the general parametric equation shown below. Initially, I varied all variables a, b, and k. By exploring what occurred when these changes were made, I was able to see that the a value changes the location of the x value, the b changes the location of the y value, and changing the k value changes the slope of the curve graphed by these parametric equations.
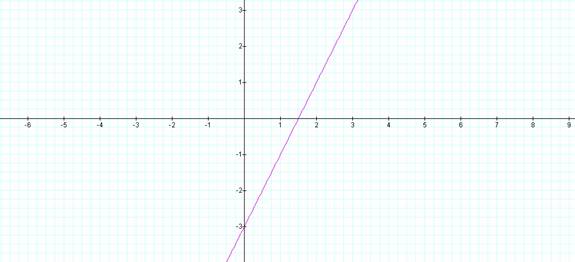
Compare the graphs shown below. In the first illustration, a=2, b=1, and k=2.
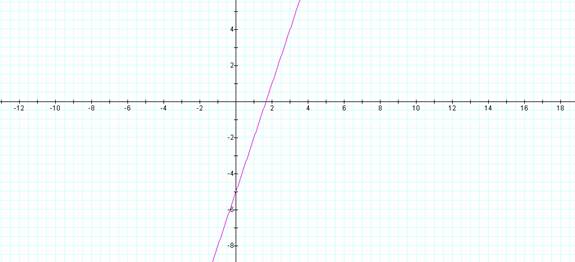
In the second illustration, a=3, b=4, and k=3.
When a and b are kept constant and the k is varied, a set of curves that go through a common point are graphed. This common point is shown to be (a, b) when t=0. Each of the curves has the slope that is the corresponding value of k. The curves shown are for a=2 and b=3. The value for k is varied from 1 to 4. The illustration shows that the curves all intersect at point (2, 3) and have slopes that correspond to the value for k.
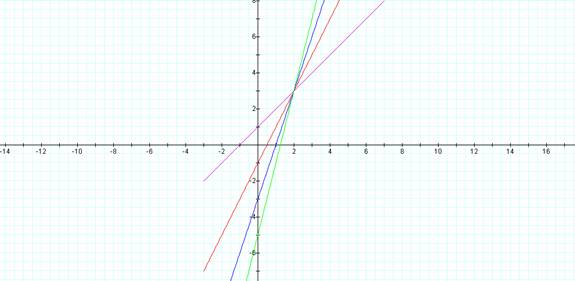
An equation for each of these curves can be derived from the parametric equations, by using the point slope form. For example, where the k is 4, y-3=4(x-2) will result in the linear equation of y=4x-5. From the graph we can see that the y intercept for the green curve is -5 and the slope of the line is 4.
To explore using Graphing Calculator, click here.
Return to main page