Quadratic Functions
|
|
Again, consider the quadratic function
f(x) = ax2 + bx + c
Suppose a and c are constant, and let b vary.
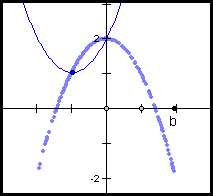
What does the locus of the vertex look like as b varies?
Make a conjecture about some properties of the equation describing the locus of the vertex as b varies. What shape is the locus? How do a and c figure into the equation?
Now that you've made a conjecture, let's rigorously determine an equation for the locus of the vertex as b varies.
We have shown that the vertex of the parabola is located at
Let Since b is varying, we want to find the y-coordinate of the vertex in terms of only x, a, and c.
There is a b2 in the numerator of
So What is t?
So And clearly c is already in terms of only x, a, and c.
Thus, the locus of the vertex as b varies is
Does this match your conjecture?
Click here to see a Graphing Calculator animation as b varies,
Click here to continue and see what happens when c varies.
|


 . This is the x-coordinate of the vertex.
 , the first term of y, and there is a b in the numerator of
  for some t that is in terms of a and c.


