First, I would like to start by investigating the following equation:
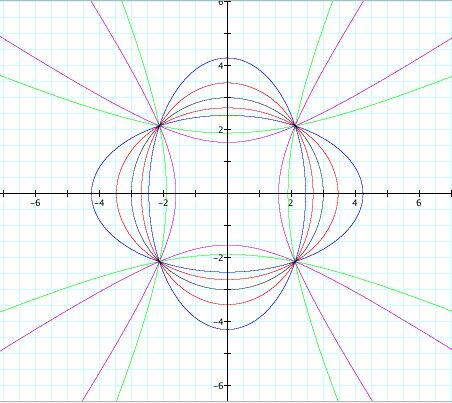
When n = 0, the graph of the equation is a circle with center (0,0) and radius 3. As n increases positively, the graph becomes an ellipse and then eventually a hyperbola. In each case, it seems as if the major axis is on the line y = -x. As n increases negatively, the graph follows a similar pattern, however the major axis now appears to be on the line y = x. Furthermore, there are two special cases, when n = 2 and n = -2, where the graph becomes a set of parallel lines. (Open up your Graphing Calculator tool and experiment with the value of n. Below is a snapshot of my own investigation).
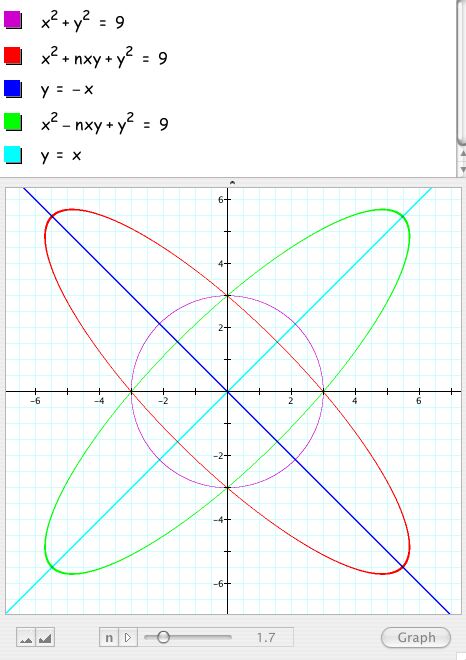
What was of interest to me was for what values of n would the graph be an ellipse, a hyperbola, or two parallel lines? In order to answer this, I went back to the general form of a conic (Ax^2 + Bxy + Cy^2 + Dx +Ey + F = 0), rewrote my original equation in this form, and then solved for B^2 - 4AC, since this is the quantitiy that would let me know which conic would be formed. The original equation was such that A = 1, B = n, and C = 1. Hence, B^2 - 4AC = n^2 - 4. A simple investigation of this parabola shows us that while n < -2 or n > 2, n^2 - 4 > 0, so we will have a hyperbola. When -2 < n < 0 or 0 < n < 2, n^2 - 4 < 0, so we will have an ellipse. The special cases occur when n = 0, in which case we have a circle, and when n = 2 or n = -2, in which case we have the parallel lines. Specifically, x^2 + 2xy + y^2 = 9 can be factored to (x + y)^2 = 9. Therefore, x + y = 3 or x + y = -3, which are two parallel lines with slopes -1. Similarly, x^2 - 2xy + y^2 = 9 gives rise to x - y = 3 and x - y = -3, which are two parallel lines with slopes 1.
The next step for me was to determine if my hypothesis of the major axes being on y = x or y = -x was correct. When B is a nonzero value in the general equation, we are said to have a degenerative conic. That is to say, the conic will not have vertical and horizontal axes. Therefore, in order to investigate a degenerative conic more effectively, it is useful to change the variables by rotating the axes back to the vertical and horizontal orientations. If I am able to show that the rotation for any value of n is actually 45 degrees, then my hypothesis will be proven.
First let (A - C)/B = cot(2u). Since A = C = 1 and B = n, we have cot(2u) = 0. Thus, u = 45 or u = -45! This is exactly what I needed! Hence, each conic is a 45 degree rotation of either a horizontal or vertical ellipse or hyperbola.
The other part that was of interest to me was what exactly was happening to the foci (and in the hyperbola case, the asyptotes) as n varied. It seemed that the foci were getting farther away from the center along the lines y = x and y = -x and that the graphs were symmetric over the same lines when n > 0 and n < 0. However, to actually prove this, it was easier for me to think of the conics as having their axes on the x- and y- axes. Therefore, I needed to change the variables.
I let x = x'cos(u) - y'sin(u) and y = x'sin(u) + y'cos(u). Using u = 45, these expressions simplify to x = (1/sqrt(2))(x' - y') and y = (1/sqrt(2))(x' + y'). We can then substitute these into our original equation and simply to get the following equation:
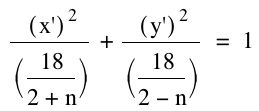
Clearly, the same values for n described above will result in an ellipse, circle, hyperbola, or parallel lines. However, I was able to go even further. Using an excel spreadsheet, I was able to see that when n < -2 the hyperbola would be vertical. Furthermore, when n > 2 the hyperbola would be horizontal with its asyptotes having reciprocal slopes for opposite n's. Similarly, when -2 < n < 0, the graph would be a horizontal ellipse while when 0 < n < 2, the graph would be a vertical ellipse with the lengths of the major and minor axes being the same for opposite n's. I would encourage you to try this out on your own on Graphing Calculator. The images that are possible are simply beautiful!