
One of the standard topics of today's high school algebra classes is quadratic equations. When I taught, I would introduce the parent function, y = x^2, and have the students investigate different translations on their graphing calculators. This approach allowed them to come up with the vertex form for the quadratic. It wasn't until after we then talked about intercept form that the students came into contact with standard form. Further, I did not really understand the beauty of this form myself, so we did not spend a lot of time on standard form except to understand the quadratic formula. The students were, however, required to graph quadratic equations that were in standard form, and for that we used formulas.
Now I have experienced standard form in a different and interesting way and if I had to do it all over again, I would use the following exlporations to spark my students interests in standard form because it is now clear to me that changing the parameters a, b, and c in y = ax^2 + bx + c opens up a whole world of mathematics.
Start with y = x^2 + bx + 1 and vary the parameter b. The vertex of the general parabola will be x = -b/2 and y = 1 - b^2/4 = 1 - x^2. Hence, the locus of vertices of the set of parabolas will be a parabola itself!
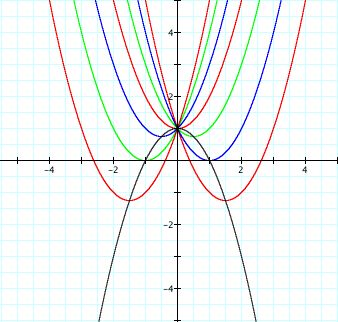
This allows the students to see the effects of b on the graph of the parabola and relates it to another parabola. A next step to take would be to try to get the students to generalize this effect for any parabola y = ax^2 + bx + c. They would first need to show that the vertex was located at x = -b/(2a) and y = c - b^2/(4a). By substituting x into the y equation, we see that y = c - ax^2. So again , the locus of the vertex is a parabola itself.
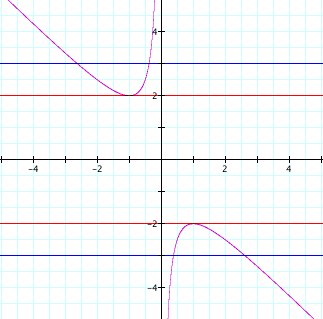
To expand on this concept, the students could also investigate the equation x^2 + bx + 1 = 0 in the xb-plane. This graph actually allows the students to look at the roots of the equation y = x^2 + bx + 1 by graphing the horizontal lines for particular values of b. In doing this, the students can see if the roots of the equation are positive or negative and if there are one, two, or no roots. This can help the students try to understand what happens to the x-intercepts as b changes which can then go onto a discussion of graphing. For example, when b = 2 or b = -2, we see that there is only one point of intersection, i.e. one real root. But when b = 3, we have two negative real roots and when b = -3 we have two positive real roots.
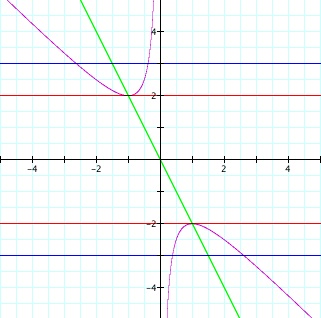
We can also observe another characterization of the vertices of these parabolas. We know that the x-coordinate of the vertex is x = -b/2. thus, if we graph this line in the xb-plane, we have an idea how the vertex and the x-intercepts are related. Notice that the line seems to be in the middle of the two points of intersection that are representing the roots. Hence the students can start to internalize the fact that the roots are symmetric with respect to the vertex. Furthermore, for the case where there is only one x-intercept, this visualization allows the students to see that this root and the vertex will be the same point.
These investigations for the importance of the parameter b from the standard form of the quadratic equation allows students to more fully understand and appreciate the power of this equation. It is a way for teachers to try to have the class visualize what is going on, make some conjectures, and then try to understand what is happening using previous knowledge of factoring and the quadratic formula. An experience like this can also allow the students to think outside the traditional xy-plane and try to get a grasp on the nature of parameters and how they can vary.