Assignment 2
I chose to write up problem #10:
Graph ![]()
Now, on the same axes, graph ![]()
Describe the new graph. Try different coefficients for the
xy term. What kinds of graphs do you generate? What coefficients mark the
boundaries between the different types of graphs? How do we know these are
the boundaries? Describe what happens to the graph when the coefficient
of the xy term is close to the boundaries.
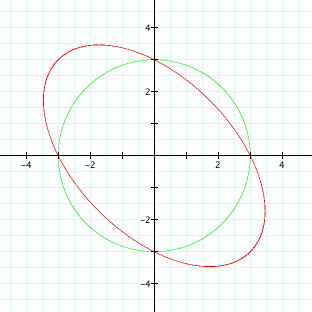
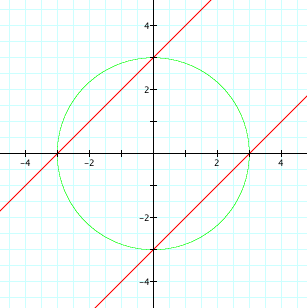
Here, we see the graphs of ![]() and
and![]() :
:
:
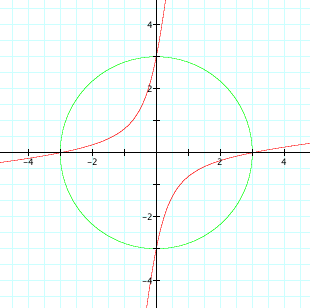
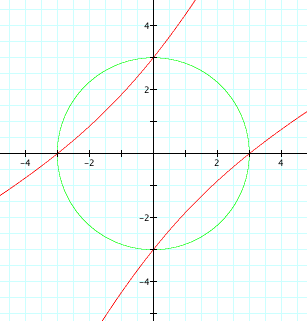
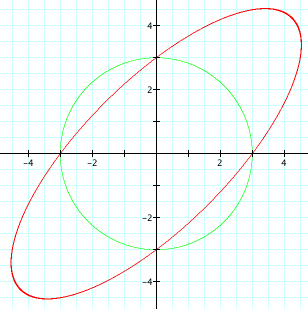
Now, we see the graph for different coefficients a,
of the xy term:
a = -10
a = -2.5
a = -2
a = -1.5
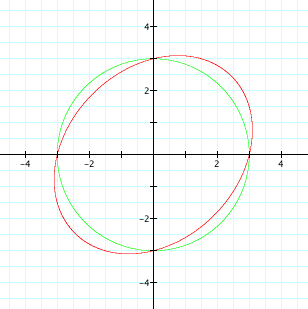
a = -0.5
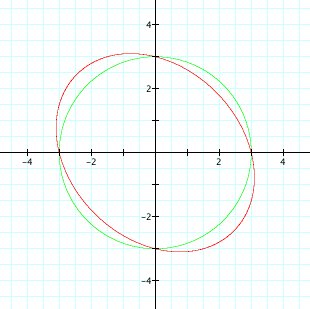
a = 0.5
a = 1.5
a = 2
a = 2.5
a = 10
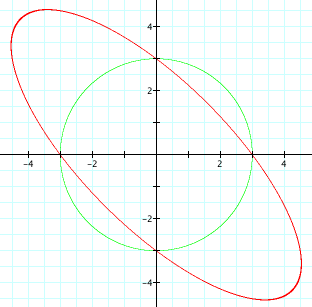
It appears that we get the graphs of hyperbolas, lines, and
ellipses, depending on the values of the coeffiecient a. It
seems that:
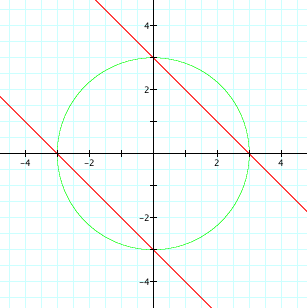
at a = 2 and a = -2, we get lines
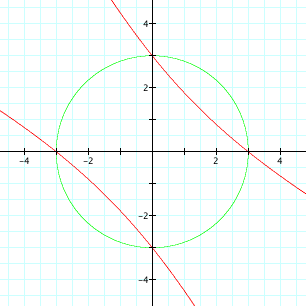
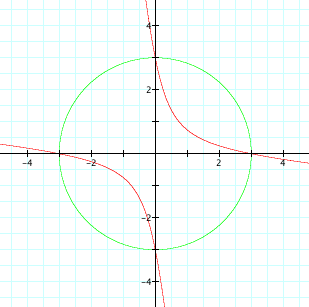
for a < -2 and a > 2, we get hyperbolas
and for -2 < a < 2, we get ellipses, with a circle when
a = 0.
We see why the boundaries are at a = -2, and a = 2 if we do a bit of algebra:
![]() ,
,
so when
![]() ,
,
![]()
giving us our two lines. Similarly:
![]()
so when
![]() ,
,
![]()
When a is close to a boundary, we can see that we get very flattened hyperbolas or very stretched ellipses.