Assignment 10 Write-up
1. Graph x = cos (t) and y = sin (t) for 0 < t < 2pi
 How
can we alter this graph in order to instigate a high school class
discussion?
How
can we alter this graph in order to instigate a high school class
discussion?
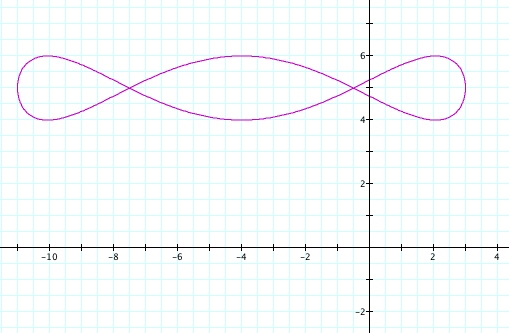
First of all, let's notice what the original graph is--the unit circle. This makes since because as t goes from 0 to 2pi, the cos and sin of t makes up a specific point on the unit circle. Notice also that the unit circle is centered at the origin.
Now, let's shake it up a
bit.
2. x = cos (t) and y = 0 for 0 < t < 2pi
 If
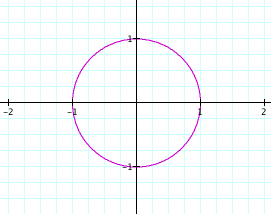
you notice, the graph is a line along the x-axis from x = -1 to
1. This makes since because the minimum value that x can have
is -1 since cos (pi) = -1 and the maximum value is 1 since cos
(0) = 1. But why does it lie on the x-axis? Because the y-value
is 0; it never changes from 0 < t < 2pi.
If
you notice, the graph is a line along the x-axis from x = -1 to
1. This makes since because the minimum value that x can have
is -1 since cos (pi) = -1 and the maximum value is 1 since cos
(0) = 1. But why does it lie on the x-axis? Because the y-value
is 0; it never changes from 0 < t < 2pi.
3. x = cos (2t) and y = sin (2t) for 0 < t < 2pi
Some
students may have thought that this circle would be larger than
the first, however it's not. Why? Because for this particular
equation, x and y can only lie between -1 and 1. Consider the
graphs y = cos (x) and y = sin (x). In each of these graphs, the
x-value corresponds to the t-value in our given equations. In
these graphs, it doesn't matter how great or small x is, the y-value
always lies between -1 and 1, just like in our given equations.
4. x = 2cos (t) and y = 2sin (t) for 0 < t < 2pi
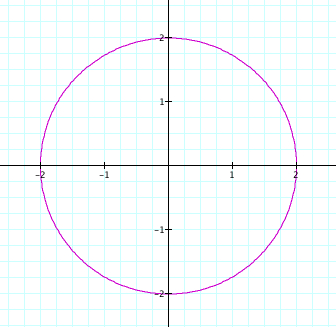 Now
we get the graph that some of the students had probably expected
earleier. Why is it bigger now? Because we are basically taking
the x and y values that we got from our first demo and doubling
them. So both x and y range from -2 to 2 (since they originally
ranged from -1 to 1).
Now
we get the graph that some of the students had probably expected
earleier. Why is it bigger now? Because we are basically taking
the x and y values that we got from our first demo and doubling
them. So both x and y range from -2 to 2 (since they originally
ranged from -1 to 1).
5. x = cos (t) + 1 and y = sin (t) for 0 < t < 2pi
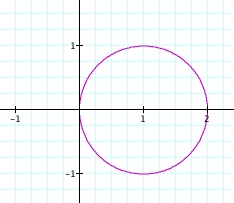 This
graph makes sense because you take every possible x-value and
add 1 to it, so it shifts the whole circle over one unit. Allow
your students to guess what would happen if it were x = cos (t)
- 1 or y = sin (t) + 1.
This
graph makes sense because you take every possible x-value and
add 1 to it, so it shifts the whole circle over one unit. Allow
your students to guess what would happen if it were x = cos (t)
- 1 or y = sin (t) + 1.
6. x = cos (t) and y = {sin (t)}/2 for 0 < t < 2pi
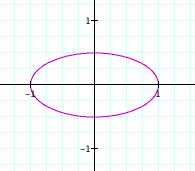 This
graph also makes sense because we are taking every y-value from
the first demo and dividing it by half. So now the min and max
values are -1/2 and 1/2. Notice that the x-values stay the same.
This
graph also makes sense because we are taking every y-value from
the first demo and dividing it by half. So now the min and max
values are -1/2 and 1/2. Notice that the x-values stay the same.
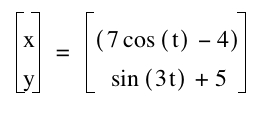
There are many other ways to alter this graph. Psyche your kids out with this one!