Use the following exploration to generate a function to predict observed data. This data is from the lumber industry, giving the approximate number of board feet of lumber per tree in a forest of a given age. What function will fit the data? Predict the harvest for ages other than those given.
| Age of Tree | 100s Board Feet |
| 20 | 1 |
| 40 | 6 |
| 60 | |
| 80 | 33 |
| 100 | 56 |
| 120 | 88 |
| 140 | |
| 160 | 182 |
| 180 | |
| 200 | 320 |
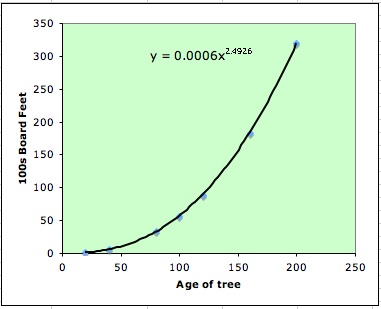
The exploration begins by looking at the scatter plot of the data.
From the graphic, we can see that the data
looks to hold a power relation. We know that a power relation
is given by the function![]() , So, our task is
to find the equation that best fit to our data with which we will
be able to make predictions and to fill out the missing data.
, So, our task is
to find the equation that best fit to our data with which we will
be able to make predictions and to fill out the missing data.
We have many ways to do it.
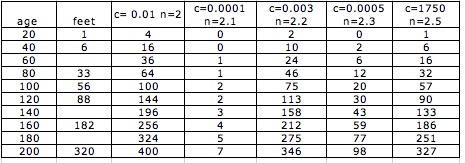
First, we can try using trial and error. In this case we have to find values for c and n such that the data that the function generates are close to the given data.
If we replace the first pair of data in the
equation ![]() , we can realize
that c has to be smaller than 1 and n has to be small. Let us
try different values for c and n. Next chart shows several data
for different values of c and n
, we can realize
that c has to be smaller than 1 and n has to be small. Let us
try different values for c and n. Next chart shows several data
for different values of c and n
You can try different values for n and c, try here.
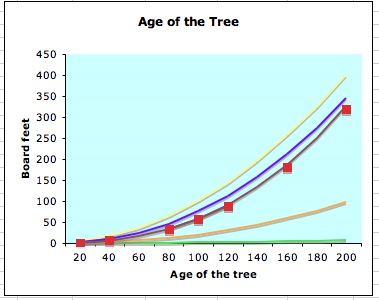
After several attempted we realize the better values for c and n. In the graphic we can see that c=1750 and n=2.5 is the best fit curve.
A second way to solve our situation is using algebra. In this case we have to choose two pair of given data to set up two equations and the solve the system (note that we are able to choose whatever pair of data).
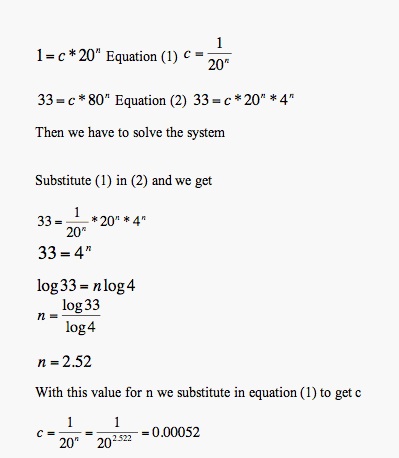
Now our function is y=(0.00052)*x^ (2.5224). If we make a graphic for our data with the new function we got, we will see that the data are really close.
Note that in general the values we get are approximate data, and for every pair of values we choose to make the prediction we will get different values for c and n. however they will be very close.
Now we are able to fill out the missing data and to predict new ones values. Using our new function our chart will look like
| Age of Tree | 100s Board Feet |
| 20 | 1 |
| 40 | 6 |
| 60 | 16 |
| 80 | 33 |
| 100 | 56 |
| 120 | 88 |
| 140 | 135 |
| 160 | 182 |
| 180 | 254 |
| 200 | 320 |
Now, if we have the age of the tree we are able to predict what the size of the board will be.
Example: let us predict the size of the board for a tree with 250 years. We have to substitute 250 in our function. So we have y=(0.00052)*250^ (2.5224)=581.52. that means that the board will be 58152 feet.