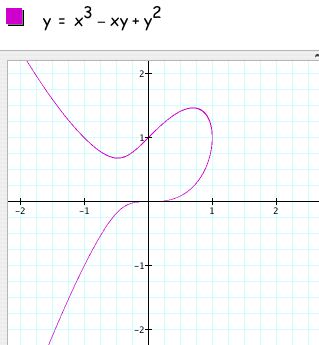
In this investigation I decided to explore the following relation and its graph.
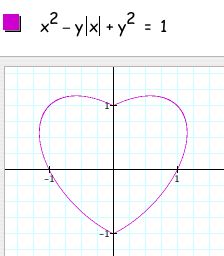
First I decided to play around with absolute values and came up with the following relations and graphs:
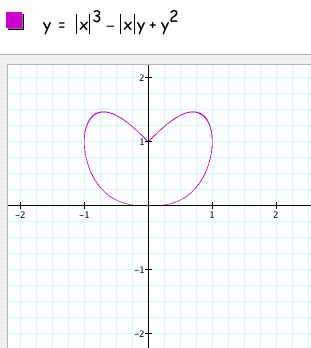
From these graphs I hypothesized that, considering the relation with no absolute values as the original equation,
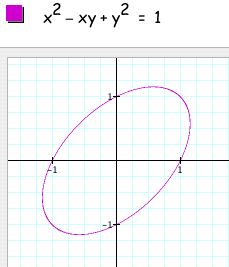
We can see why this happens if we break down what absolute value means. By taking the absolute value of x, we are not changing the relation as long as x is positive, i.e. in quadrants I and IV. But when x is negative the relation changes to x^2 +xy + y^2=1, which is an ellipse centered on y = -x, as shown below:
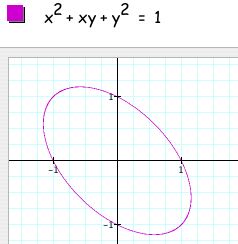
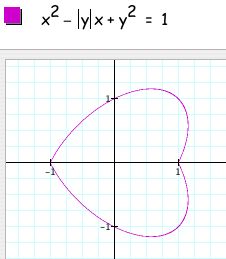
And so when x is negative, i.e. in quadrants II and III, quadrants II and III from the above graph result.
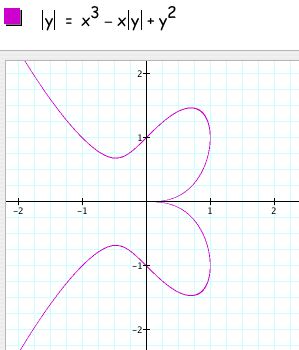
The reasoning for this is comparable to the above arguments only with the quadrants where y is negative, i.e. quadrants III and IV changing.
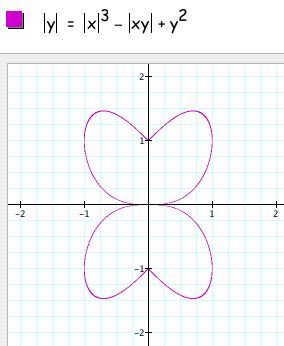
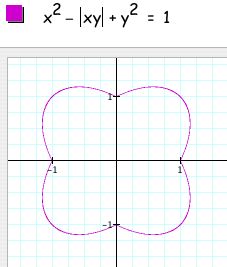
When we are taking the absolute value of both
variables, the relation does not change when both are positive
or when both are negative (because xy would have been positive
anyway), i.e. in the first quadrant. When just one is negative,
i.e. in quadrants II and IV, the relation again becomes x^2 +
xy + y^2 = 1.
I decided to look at a couple of other relations to see if the reflections still hold when absolute values are taken. The bulleted observations above did indeed hold with all relations of two variables that I tried. One of the examples is shown below.