
Assignment 10: Parametric Curves
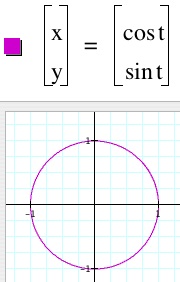
Parametric equations are a convenient way to represent some curves as functions. In these functions, a third variable, usually t, is allowed to run through some set of values, usually an interval in the real number line. Then x and y are both defined in relation to this new variable. For example, a circle cannot be expressed as a function of x in the regular coordinate system. However, it can be expressed as a function of time in the complex plane, as shown below:
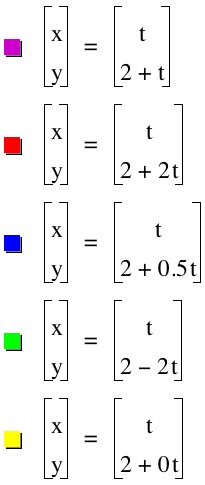
This investigation will be an introduction to more simple parametric equations. I will start with the base case: x = t and y = t. Then I will vary the coefficient of t in the y equation and see how this affects the graph.
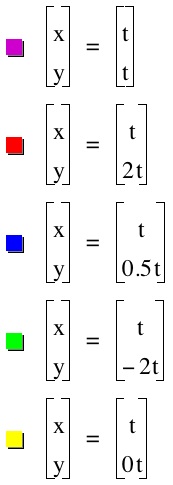
Our base case gives us the familiar line y = x. Reexamining the parametric equation, we see why. Whatever t is will be the value of both x and y. So x = y. When I change the coefficient of t in the y equation I am changing the rate of change of y, but not of x. In other words, I am changing the rate of change, or slope, of the line. If y is changing faster than x, like in the red or green example, we get a steep line. If y is changing more slowly, then we get a flatter line, like the blue line or the yellow line (lying on the x-axis). Note that in the yellow line, y is not changing at all, so the slope is 0.
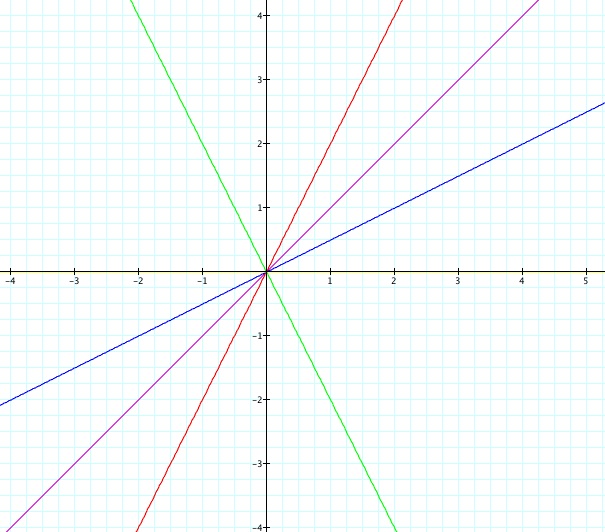
All of these line pass through the point (0,0). This happens because any number times 0 is 0, so that the y-coordinate will be 0 when t is 0, as will the x-coordinate. So if we add or subtract constants from our x and y equations, we may expect that the lines do not go through the origin any longer. Let's investigate.
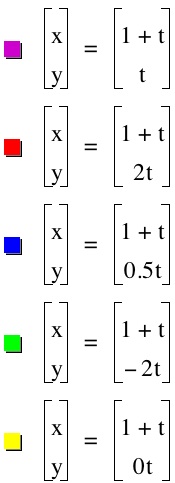
All the graphs have shifted to the right, even the yellow line has. In order to see that I have only graphed the lines for t values from -3 to 3. In our base case, the x values would have gone from -3 to 3, but now they go from -2 to 4. So even the yello graph has shifted to the right one. Again, looking at the parametric equations, this makes sense. The x equations all have an extra 1 beyond the base case.
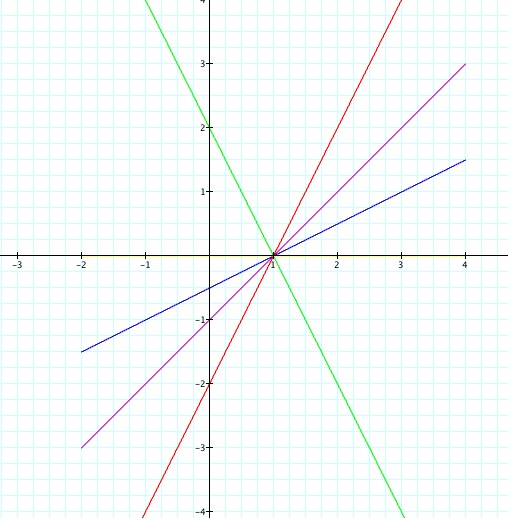
By this logic, if I add 2 to all the y equations instead of adding 1 to the x equations, I should get all the original graphs shifted up 2, so that the y-intercept will be 2.
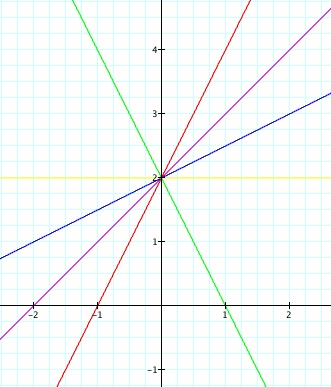
It worked! OK, now let's try adding numbers to both the x and y equations. I will add 2 to all the x equations and -3 to all the y equations. I hypothesize that the resulting lines will all go through the point (2,-3), but will have their original slopes.
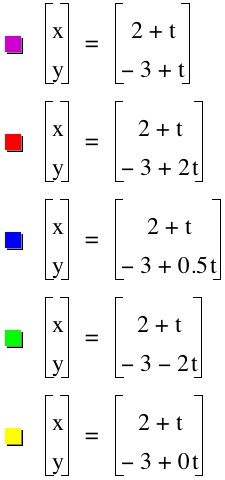
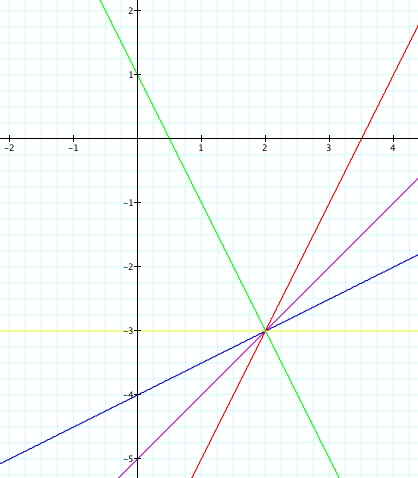
Sure enough! I hope you understand parametric equations a little bit better at this point.