
Assignment 12: Investigations With Spreadsheets
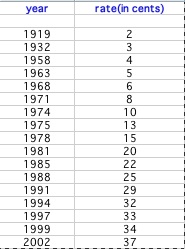
In this investigation I will use Excel to make a graph of data on the cost of US first-class postage stamps. Next I will use Excel to help me check my prediction functions. The original data is shown below.
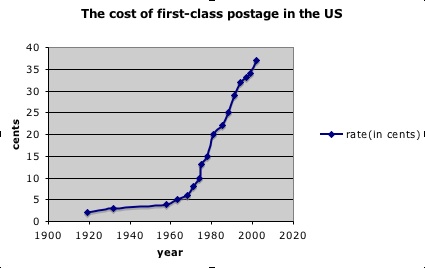
The scatterplot looks vaguely exponential, although the rate of the rate of change seems to be slowing down in the later years.
Now I would like to find a prediction function. Because the graph looks exponential, I will start with the exponential function as my base function.
![]()
But starting our function at year 0 wouldn't make a lot of sense, so I'll shift the function over so that the year 1919 is our reference year.
![]()
I know I want the cost in 1919 to be 2 cents, so I'll add one to the output function to make sure that point is on my graph.
![]()
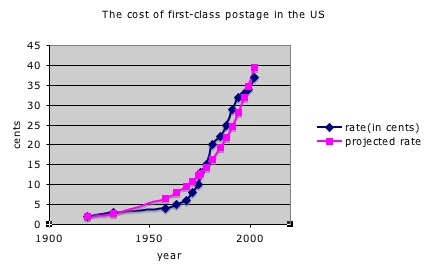
Then I tried several values for the rate of increase, and found 0.044 to give reasonable good results. Putting everything together, my final prediction function is:
![]()
The graph is shown below in pink.
So now let's use my theoretical function to answer some questions. I want to know when the 1st class rate will reach $0.65 and when it will reach $1. I also want to know when my function would figure the next 3 cent increase would be. I answered these questions using Excel. I added more years to my first column and programmed my third column to give the values of my function. I then looked for the first year the rate was $0.65, the first year it was $1 and the first year it was $0.40 (a $0.03 increase over the value in 2002). The answers are 2014, 2024 and 2003, respectively. However, it is now 2006 and the stamp is only 39 cents. So my model is probably overestimating the future projected rates.
Regardless of my ability to come up with a good estimating function, this investigation did help me learn about Excel.