
In this assignment I investigate the affect of changing one constant in a quadratic function.
Given the following equation, I will present what happens when d is varied:
![]() .
.
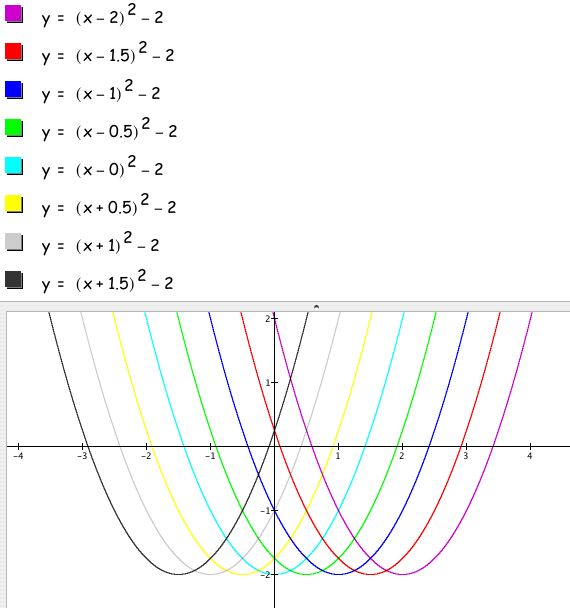
As you can see, as the values for d moved from positive 2 to negative 1.5, the graphs of the parabola moved to the left. In particular, when d=0, the parabola is symmetric about the y-axis, and when d=1, the graph has translated one to the right; when d=-1, the graph has translated one to the left. So we could hypothesize that adding or subtracting a constant to the x-value of an equation moves the graph to the left or right. Specifically, the number being subtracted from the x-variable, or dependent variable, tells us how far to the right to translate the figure.
I checked out whether this hypothesis held for a different function:
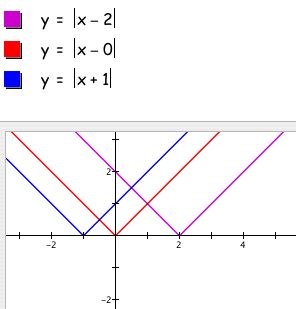
It did! Now I tried to figure out why changing d translates graphs along the x-axis, and here is what I figured out:
First of all, let us consider that d is positive for a moment. Then when we subtract d from x, x becomes the x-value d to the left. So x will now take the y-value that used to be d units to the left, which will make the graph appear to have shifted d units to the right. If d is negative, then x is assuming the y value of a neighbor to the right, and so the graph will appear to have shifted to the left.