
Coefficients
of xy and the Relationship in the Equation
y = 2x2+3x-1+xy.
By Tonya C.
Brooks
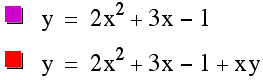
Many of us have worked with plenty of quadratic equations such as y = 2x2
+ 3x – 1. When we change
the coefficients on these three terms, we can see that we either shift the
graph, make the graph fatter and skinnier or point the graph up or down. I will not go into this here because I
want to take a look at what happens when we have an xy term added to these
types of equations.
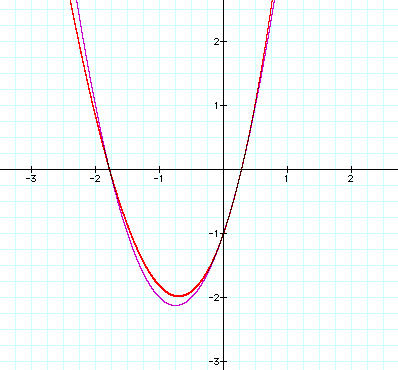
For our sake, let’s just take the earlier equation and add an xy term to
it so we have y = 2x2 + 3x – 1 +xy. First let’s compare the two graphs.
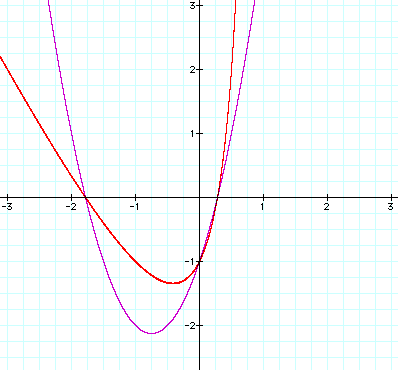
So, what happened? Well,
from looking at this it looks like we pulled the left side out a little and the
right side in a little and maybe pulled the vertex a little. It doesn’t look like much happened
here. Sometimes though we are just
looking a little too closely and we cannot see the whole picture. Let’s pan out a little and see if there
really is anything else out there.

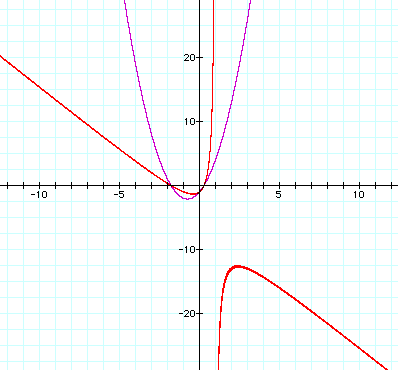
As
you can see, when we set our y – axis so that we can see from -25 to 25,
something else pops up – another portion of the second mapping.
So
what is really going on here? Well
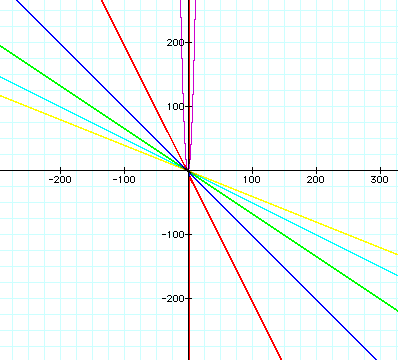
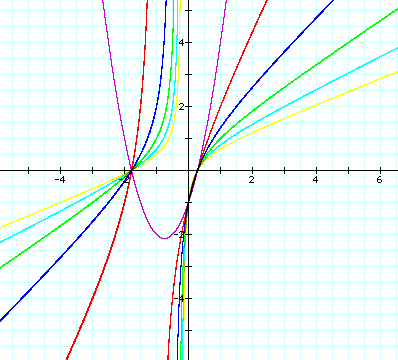
let’s take a look at a few others in which we change the coefficients on xy.
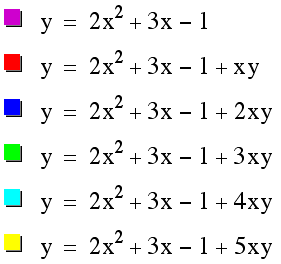
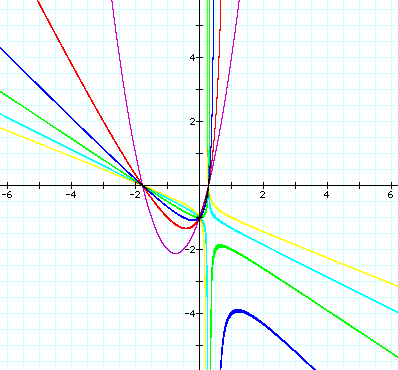
From looking at the graph, it becomes pretty clear that something
changes about the graph. If you look
at when the coefficient is 3 the graph still looks fairly close to the way it
did before. However, if we look at
the graph when the coefficient is 4, there is a big difference than what we
have seen so far. Apparently
something is happening between 3 and 4.
Also, if you notice, all the graphs meet in exactly three points –
two intersections when y = 0 and one when x = 0. This happens because when y = 0, all the equations are 0 =
2x2 + 3x – 1 which gives the x-intersections and when x = 0
all the equations are
y = -1, which is the y-intersect.
Back to our graph, let’s look at what is going on between having 3 as
our coefficient and having 4.
As
you can see here, it looks like having 3.5 as a coefficient causes the two
portions of the graph to meet. If
we were to take a closer look we would see that this is not the case
however. Click
here to watch a clip about what is happening between 3 and 4.
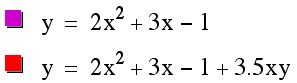
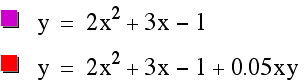
Let’s also take a look at what happens when our coefficients for xy are
close to 0. When the coefficient
is zero, then the two graphs are the same. Let’s look at our graph when the xy coefficient is really
close to zero.
This isn’t all that unexpected.
The closer we get to zero, the closer the two graphs should be to being
the same. However, something else
is happening that we cannot see here in this graph. Let’s zoom out to see it.
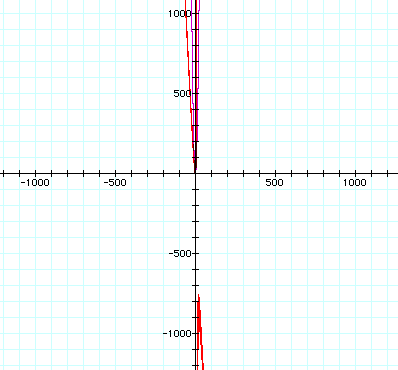
We
had to zoom out pretty far to be able to see the second part of the graph. What do you think will happen if we get
a little closer to zero? Let’s try
with a coefficient of .05.
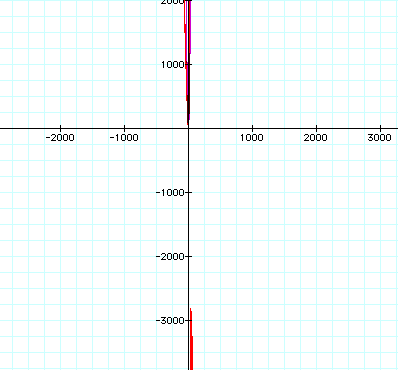
Here we had to zoom out until we could see
the -3000 mark for the y-axis.
It seems that the closer we get to zero
with our coefficient, the farther away we have to go in order to see the lower
half of the graph.
Up until now, we have just been looking at
the graph when we have a positive coefficient. Do you think there will be a big change in the graph if we
make the coefficient negative?
Let’s take a look.
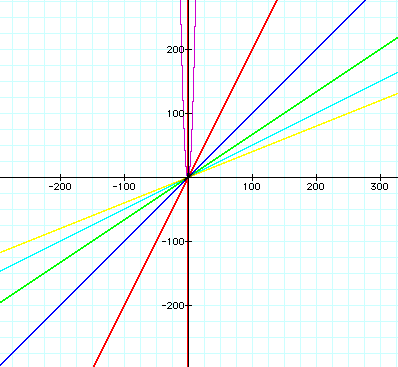
Oops! I forgot to zoom back in! That’s okay though because do you notice anything about this
graph as it looks. No? Here, take a look at what we had when
the graphs had positive coefficients and we had zoomed out this far.
Now do you see a relationship? We already have a close up of this
graph (scroll up to see) so let’s look at the other graph close up. Any guesses as to what it might look
like?
Were you correct in your guess? Some of these are not exactly what I
expected either. None of these
with negative coefficients give graphs that look similar to the graphs we got
for 1, 2 and 3 as our coefficients even though from far away the two graphs
looked like opposites.
Also, if you notice, the smaller our coefficient
gets (the more negative) the closer our graphs get to the two axes. The left side gets closer to the
positive portion of the y-axis and to the negative portion of the x-axis and
our right side of the graph gets closer to the positive side of the x-axis and
to the negative side of the y-axis.