
Parabolas
By Tonya Brooks
One of the common graphs that you might be
required to do in your mathematics classes is graphing a parabola. These are equations that satisfy the
equation y = ax2 + bx + c for some values a, b, and c in the real
numbers. Let’s take a look at
several of the graphs of y = x2 + bx + 1 for different values of b.
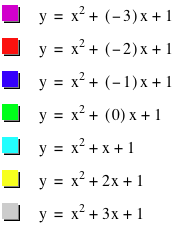
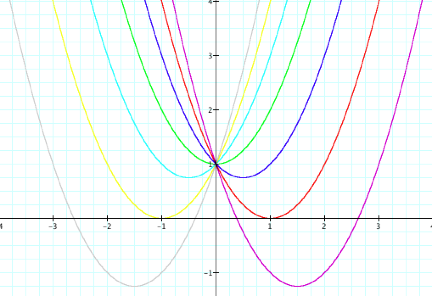
In the above graph, I have let b range
from -3 to 3 with integer values.
If you notice, when b = -3, the graph has been shifted to the right and down
a little. As b becomes larger, the
mapping shifts a little to the left and up. And then when b is zero, we get the graph of y = x2
+ 1. Then again, as b goes to 3,
our graph continues to shift to the left only with b being a positive integer,
our graph shifts down instead of up.
In all of these graphs, the parabola opens
upward, so our b value has no effect on this what so ever. Also, all of the graphs have a
y-intercept of -1 (which we can tell from the +1 added at the end of our
functions).
Also, for b values between -1 and 1, we do
not have any real roots for the equations. We would have two complex solutions (not necessarily unique)
that can be seen using the quadratic formula. When b equals 1 or -1, then we
get one solution to our equation, and for values of b that are less than -1 or
larger than 1, we get two real roots.
All of this can be done by calculations using the quadratic formula or
factoring. I will not go into
those here.
If you look at all the minimums for all of
these graphs for y, what do you notice?
Can’t see it? Try drawing
lines that connect the minimums.
That might make it a little easier.
If we use our imagination, this looks a
little like a rough parabola itself.
Let’s take a look at what is happening from a mathematical standpoint.
To find all the minimum points for y = x2
+ bx +1, we can find the derivative and set the derivative equal to zero.
The derivative of y is y’ = 2x + b. Setting this equal to zero, we get x =
-b/2. For these values of x, we
get a collection of points for the minimum values for our graphs. We just need to find what values of y
we will have. Using our equation,
we get y = (-b/2)2 + b(-b/2) +1 which simplifies down to y = -b2/4
+ 1.
Now we have a collection of points (x, y)
= (-b/2, -b2/4 + 1). If
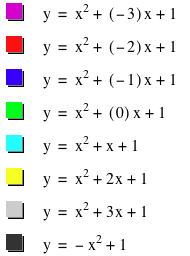
we write this as an equation where y is a function of x we see that y = -x2
+ 1.
From the definition of a parabola, we can
see that this new function is a collection of points that define an equation of
a parabola. Let’s take a look at
what it looks like with our other graph.
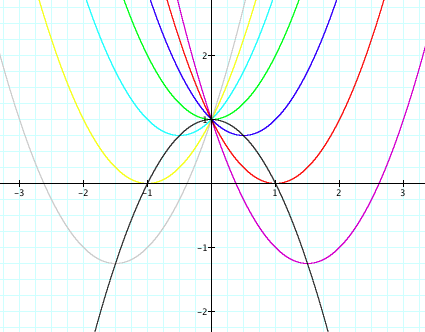
From the new graph, you can see how this
new mapping fits in with the others and can see that it goes through the
minimum values for our original graphs.
The reason that it looks so smooth
compared to our rough sketch is simply because in our construction and
calculations for this new function, we allowed b to be anything. If we drew our original functions for
all real values of b from -3 to 3, we would see that our new function still
goes through the minimums.