
ASSIGNMENT12
BY
SHADRECK SONES CHITSONGA
SPREADSHEET
This write up is
about the use of the spreadsheet in alleviating some of the tedious
calculations involved in calculating compound interest. There are a number of
ways that compound interest problems can be solved.
Before we do this
let us have a quick review on graphs of exponential functions.
Let us consider
the graph of ![]()
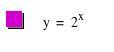
Graph 1
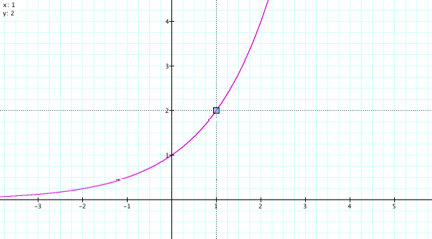
Most of the high
school students are familiar with the graph 1. Using the graphing calculator,
it is easy to read off different values of y and x. Students will need this
kind of skill when we look at compound interest.
What are some of
the methods that we can use to solve compound interest problems. In this write
up we will look at a few of them. But remember our main focus is on the use of
the spreadsheet to solve compound interest problems. The assumption here is
that the students have already been exposed to the other methods of solving
compound interest and that they are familiar with the main concepts on compound
interest.
Let us consider
this question:
John deposits
$500 in a savings account at 5% annual interest. Find the value of his account
after 5 years.
Method 1
Compound interest
can be solved “manually” by calculating the simple interest every year and adding to the
principal. Are there any problems with this method? Look at the example below
and say what you think about this.
Solution
Amount 1st year
$500
Interest 1st year
$500 X .05 = $25
Amount 2nd year
$500 + $25 = $525
Interest 2nd year
$525 X .05 = $26.25
Amount 3rd
year
$525 + $26.25 = $551.25
Interest 3rd year
$551.25 X .05 = $27.5625
Amount 4th
year
$551.25 + $27.5625 = $578.8125
Interest 4th year
$578.8125 X .05= $28.940625
Amount 5th
year
$578.812+$28.940625 = $607.753125
Interest 5th year
$607.753125 X .05 = $30.387656
Amount 6th year
$607.753125 + $30.387656=$638.1407813
Therefore the
amount after 5 years is approximately $638.14.
Now can you
imagine how tedious the calculations would be if we were to calculate the
amount John will have in his account after 40 years.
Ok, may be that is
the time to use the formula for calculating compound interest.
USING FORMULA
![]() Where P is the principal, initial amount, R is the rate in %, t is the time period and
A is the value of the
sum P invested in t years, at the rate of R% per year.
Where P is the principal, initial amount, R is the rate in %, t is the time period and
A is the value of the
sum P invested in t years, at the rate of R% per year.
Now let us apply
the formula to the same problem.
P = 500
R=0.05 , and t =5
A= P(1+R)^t = 500(1+.05)^5= 638.14.
This is
straightforward and very easy to apply. We get the same answer as in the first
method. It seems it is not a problem if we were asked to calculate the amount
John will have in his account after 40 years. In this case it is simply a
question of putting t =
40 in the formula. That should not be very involving.
But now what about
if we wanted to know the amount in John’s account every year for the next 40
years. Yes we can use the formula. How many times do you have to apply the
formula to come up with the answer? You may want to try. Of course one can use
the formula and plot a graph by using the formula, just as we did in graph 1.
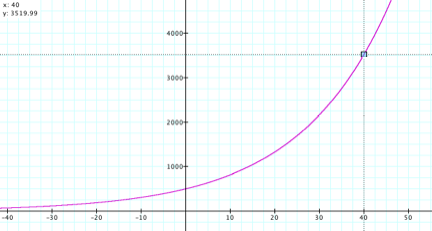
Graph 2
Using the formula
seems to be ok so far. If we have to plot the graph, then we can read off
different values. But the drawback here is that we can only look at a
particular pair of values at any given time. What about if we wanted to see the
amount in John’s account in years 1-40, all at the same time? We might not be
able to do that using this approach. So what do we do? What about using the
spreadsheet. Look at the example below.
USING THE
SPREADSHEET
So far we have
discussed two methods. The third method involves the use of the spreadsheet.
The table below shows the amount John will have in his account starting from
year 0 to year 40.
TABLE 1
|
Principal |
1+RATE |
YEARS |
AMOUNT |
|
500 |
1.05 |
0 |
500 |
|
500 |
1.05 |
1 |
525 |
|
500 |
1.05 |
2 |
551.25 |
|
500 |
1.05 |
3 |
578.8125 |
|
500 |
1.05 |
4 |
607.753125 |
|
500 |
1.05 |
5 |
638.1407813 |
|
500 |
1.05 |
6 |
670.0478203 |
|
500 |
1.05 |
7 |
703.5502113 |
|
500 |
1.05 |
8 |
738.7277219 |
|
500 |
1.05 |
9 |
775.664108 |
|
500 |
1.05 |
10 |
814.4473134 |
|
500 |
1.05 |
11 |
855.1696791 |
|
500 |
1.05 |
12 |
897.928163 |
|
500 |
1.05 |
13 |
942.8245712 |
|
500 |
1.05 |
14 |
989.9657997 |
|
500 |
1.05 |
15 |
1039.46409 |
|
500 |
1.05 |
16 |
1091.437294 |
|
500 |
1.05 |
17 |
1146.009159 |
|
500 |
1.05 |
18 |
1203.309617 |
|
500 |
1.05 |
19 |
1263.475098 |
|
500 |
1.05 |
20 |
1326.648853 |
|
500 |
1.05 |
21 |
1392.981295 |
|
500 |
1.05 |
22 |
1462.63036 |
|
500 |
1.05 |
23 |
1535.761878 |
|
500 |
1.05 |
24 |
1612.549972 |
|
500 |
1.05 |
25 |
1693.17747 |
|
500 |
1.05 |
26 |
1777.836344 |
|
500 |
1.05 |
27 |
1866.728161 |
|
500 |
1.05 |
28 |
1960.064569 |
|
500 |
1.05 |
29 |
2058.067798 |
|
500 |
1.05 |
30 |
2160.971188 |
|
500 |
1.05 |
31 |
2269.019747 |
|
500 |
1.05 |
32 |
2382.470734 |
|
500 |
1.05 |
33 |
2501.594271 |
|
500 |
1.05 |
34 |
2626.673985 |
|
500 |
1.05 |
35 |
2758.007684 |
|
500 |
1.05 |
36 |
2895.908068 |
|
500 |
1.05 |
37 |
3040.703471 |
|
500 |
1.05 |
38 |
3192.738645 |
|
500 |
1.05 |
39 |
3352.375577 |
|
500 |
1.05 |
40 |
3519.994356 |
|
|
|
|
|
What is the
advantage of using the spreadsheet? May be the question should be what are the
advantages of using the spreadsheet?
1. In the
spreadsheet we simply enter the principal, (1+ rate), years and the formula,
and
we get all the amounts we
need in a fraction of a second.
2. THINK about other advantages.!!!!
Using the
information from table 1 it is very easy to come up with a curve shown in
figure 2.
This curve shows
that the amount in the account grows exponentially. The formula that is used to
calculate the amount is an exponential function as seen in method 2.
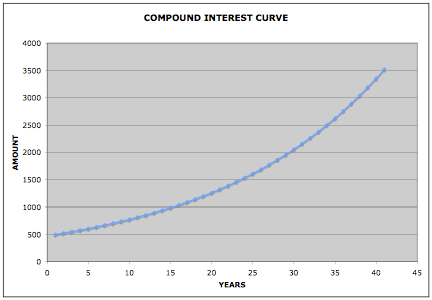
Graph 3
In comparison to
the second method, the spreadsheet has an advantage in that we can see all the
values we need at the same and we can draw the curve easily as shown here. In
method 2, as discussed already we need to read off values from the curve. This
is just one example, there are more other applications of the spreadsheet. You
might want to find out how you can incorporate the use of the spreadsheet in
your lesson
RETURN