HYPERBOLA
By
SHADRECK S CHITSONGA
Let us firstly look at the main
features of a curve known as the hyperbola. The diagram below shows the main
features of the hyperbola.
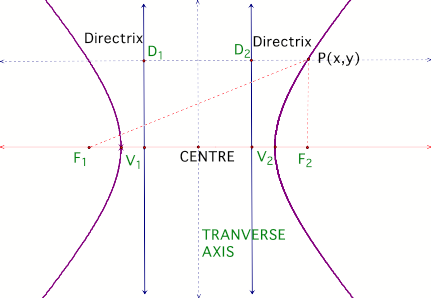
A hyperbola is a set of points
(x,y) in the plane whose distances from two fixed points have a constant
difference. The two fixed points are called the Foci. Unlike the parabola that
has one continuous curve, the hyperbola is made up of two branches and two foci
as.
In the diagram below V1 and V2
are the vertices.
In a hyperbola the ratio
PF1/PD1 is the same as the ratio PF2/PD2.
This ratio is known as the
eccentricity of the hyperbola.
Though the diagram below is not
drawn to scale it is clearly that this ratio is certainly greater than 1.
Without going into rigorous
mathematics, just look at the (rectangle) D1 P F2 V1 , PF1 is greater than the
diagonal of this rectangle, therefore greater than PD1( Applying Pythagorean
Theorem). The hyperbola shown in figure 1 has its transverse axis parallel to
the y-axis.
Figure
1
Continuing with our discussion
on the graphs of functions of the form r=![]()
We will now consider the case
when e is
greater than 1, and look at different values of k.
In the case of the parabola the
value of e
is exactly one.
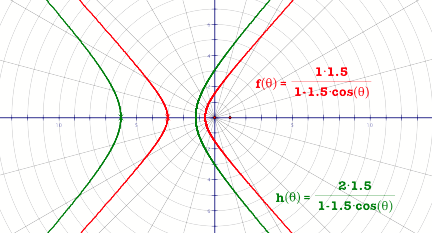
Figure
2
In this case the eccentricity
is greater than one and the curve we get is a hyperbola.
What happens when the
values of e and f are changed?
Changing the value of k seems
to change the location of centre of the hyperbola. As the value of k increases
the branches of the hyperbola are pulled further apart. The value of k determines where one
branch of the hyperbola crosses the y-axis.
For example if k = 2, the curve
crosses the y-axis at (0,2) and (0,-2).
Increasing the value of e brings the branches of the
hyperbola close together.
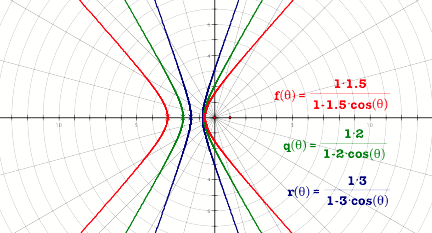
Figure
3
CLICK to open GSP to see what happens when the denominator has a
positive sign instead of the negative sign. What is
your conclusion? What features if any of the graph are affected by this?
We will now investigate the
effect of having a sine function in the denominator rather than cosine.
Look at figure 4.
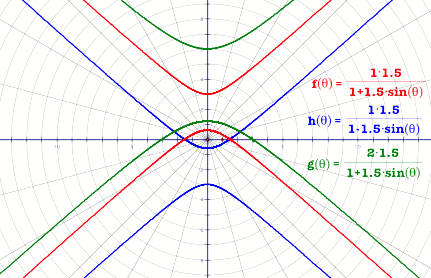
Figure
4
There are a number of
observations we can make here.
1. All the three curves shown above have their transverse
axis parallel to the x-axis. Compare this to when
there
is cosine in the denominator.
2. The curves that have a +sin q in the denominator have
there tranverse crossing the positive y-axis and with
-sin q, the transverse axis crosses
the negative y-axis.
3. The product of the
denominator (ke)
determines the
point where one of the branches of the curve crosses
the x-axis.
4. Keeping everything constant,
the higher the value of k,
the further the curve moves up along the y-axis.
END