
ASSIGNMENT 3
BY
SHADRECK S CHITSONGA
PARABOLA AS THE
LOCUS OF VERTICES OF OTHER PARABOLAS
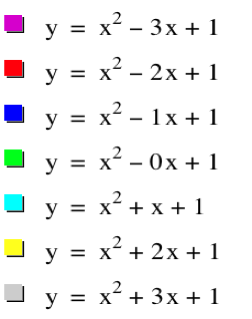 The graphs shown in figure 1 are graphs of the
function
The graphs shown in figure 1 are graphs of the
function ![]()
The values of b are set at
-3,-2,-1, 0, 1, 2 ,3.
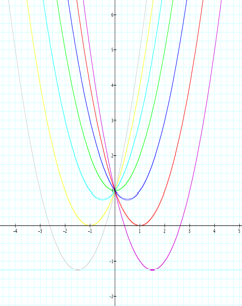
Figure 1
There are a number of things that we know from our
study of quadratic functions. Though that is not the main focus of this write
up, we will mention the following things.
1. All
the graphs are concave up because the coefficient of ![]() is positive.
is positive.
2. All
the graphs pass through the same point, that is (0,1), because all the
functions
plotted have the same value of c, c =1.
3. All
the graphs have different vertices, they have different values of b.
We will expand on number 3 further. Let us go back to
the basics of quadratic functions. Any quadratic function is of the form ![]() .We know that the line of symmetry is at x=-b/2a,
From our examples above the vertex is at
.We know that the line of symmetry is at x=-b/2a,
From our examples above the vertex is at ![]() .
.
Look at the vertices of the functions whose graphs
are plotted in figure 1:
FUNCTION
VERTEX
![]()
![]()
![]() (1 , 0)
(1 , 0)
![]()
![]()
![]() (0,
1)
(0,
1)
![]()
![]()
![]() (-1,0)
(-1,0)
![]()
![]()
Now that we have the vertices we can plot the points
to determine the relationship between x and y for the vertices. Figure 2 shows
the vertices as plotted in GSP
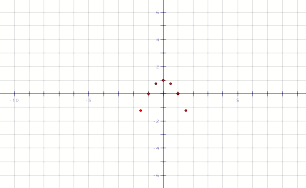
Figure 2
Clearly we can see from the plot that this curve is
that of a parabola. It is not difficult for us to determine the equation for
the function that generates this parabola. This curve crosses the x-axis at -1
and +1. This implies that the equation is (x-1) (x+1)= ![]()
But the curve is concave down, so the equation is y=-(![]() )
)
Figure 3 shows that the locus of the vertices of
the set of parabolas graphed from ![]() is the parabola
is the parabola ![]()
![]()
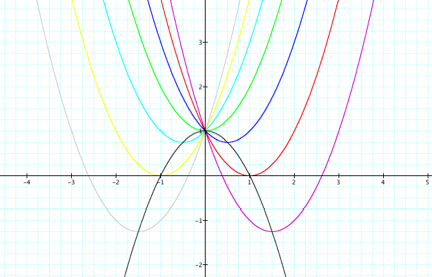
Figure 3
Can we write a general result here? Let us look at the original function ![]() . Where c =1.
. Where c =1.
Observe the following:
1. The coefficient of ![]() is -1 while in
the original it is 1.
is -1 while in
the original it is 1.
2. The original expression has b in it. The new expression has the value of b as 0.
3. The original equation has c
=1 and the new equation has c=1.
It looks like we can conclude that for the function ![]() the resulting
parabola will be
the resulting
parabola will be ![]()
Before we may a sweeping statement. Let us consider
the graphs below to see if our conclusion is indeed valid.
Let us consider the function ![]() , where the values of b are as before.
, where the values of b are as before.
Here if our conclusion from the previous example is
true then we expect the locus of the vertices to be the parabola ![]() . We will plot all the functions together and see whether
this parabola will indeed pass through the vertices. Refer to figure 4.
. We will plot all the functions together and see whether
this parabola will indeed pass through the vertices. Refer to figure 4.
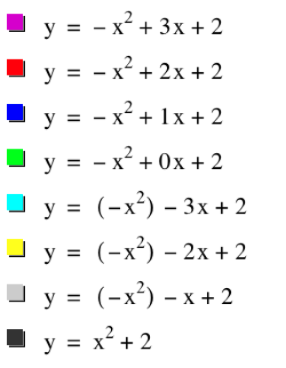
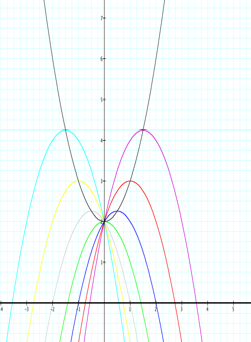
Figure 4
In conclusion we can say that as long as a and c
remain constant, the vertices of the parabolas generated by ![]() , will always be
, will always be
![]() .
.
END