_files/image003.png)
ASSIGNMENT 10
BY
SHADRECK S CHITSONGA
Let us start by doing a quick review of the ordinary
equations.
y = mx + c is the general form of a linear function. We know
that when we plot this function in the Cartesian plane we get a straight line.
This was explored in assignment one on graphs of linear functions. The same is
true with the quadratic functions, which we explored in assignment 2.
Now that we are familiar with these functions and
their graphs, we want to switch our attention to parametric equations.
But what are parametric equations and what makes them
different from the other equations.
Let us look at the following functions,
(i) x = t - 3
(ii) y =
2t + 5 , we will plot these equations. t ranges from -7 to 10. Refer to figure 1.
_files/image006.png)
Figure 1
This is the graph of y = 2x +11
_files/image009.png)
Figure 2
1. Each point on the curve must be related
to a unique value of the parameter.
2. Each value of the parameter must give
the coordinates of only one point
on the curve.
A parametric curve in the plane
is a pair of functions
x = f (t)
y = g (t)
It is possible to derive the Cartesian equation from
the parametric equations. Let us just look at a simple example.
(i) x = t - 3
(ii) y = 2t + 5
Substituting that in (ii) we get y = 2 (x +
3) +5 = 2x +11
Now we can see why we get the same line apart from the
different lengths.
1.Let us consider y = sin (t)
x = cos (t )
for 0 < t< 2pi
_files/image012.png)
Figure 3
x = cost (t ) 0![]() t
t![]() 2pi
2pi
we get a
circle with radius one. Does that surprise you? Let us look at the equation of
this circle, ![]() Is there any connection between the equation of the circle
and our parametric equations?
Is there any connection between the equation of the circle
and our parametric equations?
![]()
![]() . Using the famous trigonometry identity
we see that
. Using the famous trigonometry identity
we see that ![]() .
.
Just for further exploration consider the following
y = sin
(at)
x = cos (bt
) for
0![]() t
t![]() 2pi
2pi
Try different values of a = b and see what happens.
i. Do you still get a circle?
ii. If the answer to part (i) is yes, what is the radius
of the circle?
iii. What is your conclusion when a
= b?
a =b all the time.
a = 2b
_files/image036.png)
Figure 4
Can we say that the curve shown in figure 4 is a
parabola? If we assume that this
is a parabola, then it must be of the form ![]() . Compare the graph shown in
figure 4 with that shown in figure 5.
. Compare the graph shown in
figure 4 with that shown in figure 5.
_files/image042.png)
Figure 5.
![]() . Why are the two graphs the same?
. Why are the two graphs the same?
We will still need to rely on our knowledge of
trigonometry to answer this question?
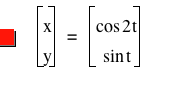
Remember x
= cos2t and y = sint. ![]() . We know that we can express cos 2t as
. We know that we can express cos 2t as ![]() .
.
We are looking for an equation of the form ![]() . First of all let us just write cos2t =
. First of all let us just write cos2t = ![]() (i).
(i).
Equation (i) can also be written as ![]() (ii). If
equation (ii) is true then it follows that
(ii). If
equation (ii) is true then it follows that
![]()
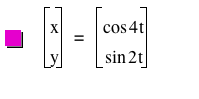
We will try one more time. We will still use a=2b,
this time a=4 and b=2. In the first example we
used a=2 and b=1.
Refer to figure 6.
_files/image065.png)
Figure 5
Can we generalize for
x = cos at
where a = 2b.
Use this
LINK to explore that. You may also want to explore what
happens when b = 2a.
Do you still get the same graph?
following parametric
equations.
x = a cos t
y = b
sin t
![]()
We
will consider cases when a is
greater than b and also when b is greater
than a
_files/image073.png)
Figure 5
Can you confirm that indeed this is an ellipse?
If it is an ellipse, what is the relationship
between a, b and the lengths of the major and minor axes?
Hint: Remember the general equation for an ellipse ![]() . Express x
. Express x![]() and express y
and express y![]() . Use the
trigonometry identity
. Use the
trigonometry identity ![]() .
.
_files/image087.png)
Figure 6
Now we get another ellipse with the major axis of
length four units and the minor axis of length two units. When we compare the
two curves it is very clear that the magnitude of a in comparison to b has an
effect on the orientation of the ellipse.
We can conclude that that if a is greater than b, the major axis of the ellipse lies on the x-axis and if b is greater than a the
major axis of the ellipse lies in the y-axis.
y = a cos t + h sin t
x = b sint t + h cost
a). We will use a =2 and b = 1 and -3 < h < 0
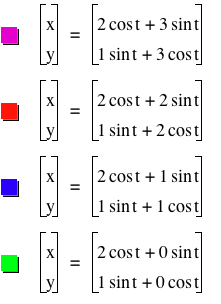
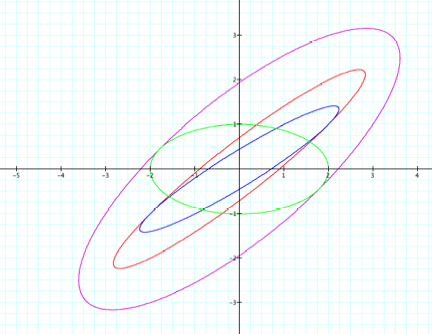
Figure 7
There are a number of things that we can observe here.
i. All the functions give curves that look like
stretched ellipses, apart from the function where h = 0.
ii. h
seems to determine the amount of stretch, the larger the h the
greater the stretch of the curve.
iii. As the value of h decreases from 3 to 0, the angle of orientation of
the curves is changing. For example the angle of inclination of the purple
curve with respect to the x-axis is greater than the angle of the red curve.
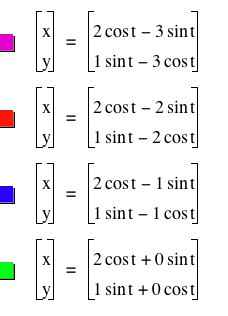
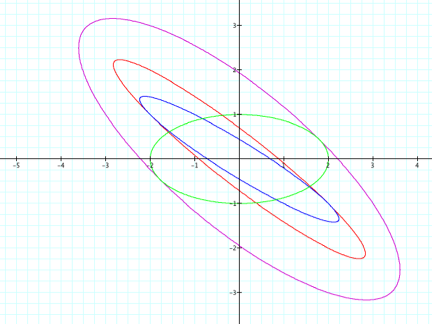
Figure 8
We can draw the same conclusions as in the first case.
The only difference is the orientation of the curves.
Here is the final picture when all the curves are
together. Refer to figure 7
Note: Curves whose functions are the same apart from
the sign of h are drawn in the
same color.
_files/image088.jpg)
Figure 9
END