
Exploration of Sine Curves
by
Chad Crumley
This exploration is of the function y =
a sin b(x - h) + k, where a, b,
h, and k are different values.
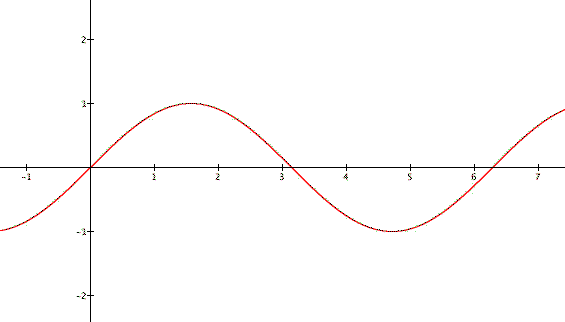
In particular, how do these values transform the graph of y= sin x. Before we begin, here is what that graphs look like
with a, b equal to 1 and h, k equal to 0.
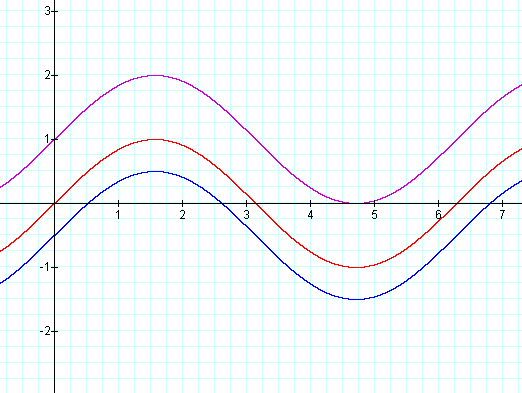
The Constant a
As a is positive and increasing, what happens to the graph? (a = 1 is in red, a = 2 purple, a = 3 aqua, a = 3.5 yellow, a = 5 blue, a = 5.8 green)
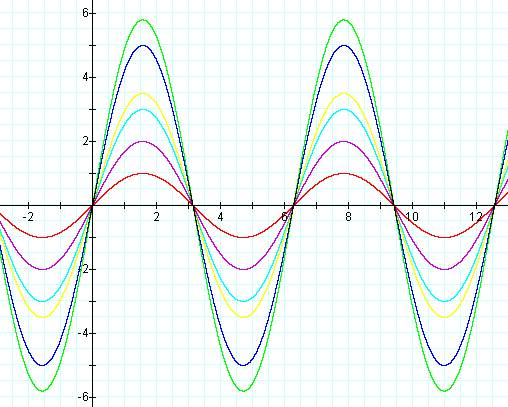
Thus a appears to stretch the graph.
The graph is stretched vertically (both in the positive and negative direction)
to the value of a. For example,
the maximum and minimum values reachedby the blue graph (when a = 5) is 5. Starting at the origin, the positive
value of a forces the graph to go
up first.
What happens as a is positive and
decreasing? (a = 1 is in red, a = 0.8 green, a = 0.7 aqua, a = 0.6 yellow, a = 0.5 purple, a = 0.2 blue)
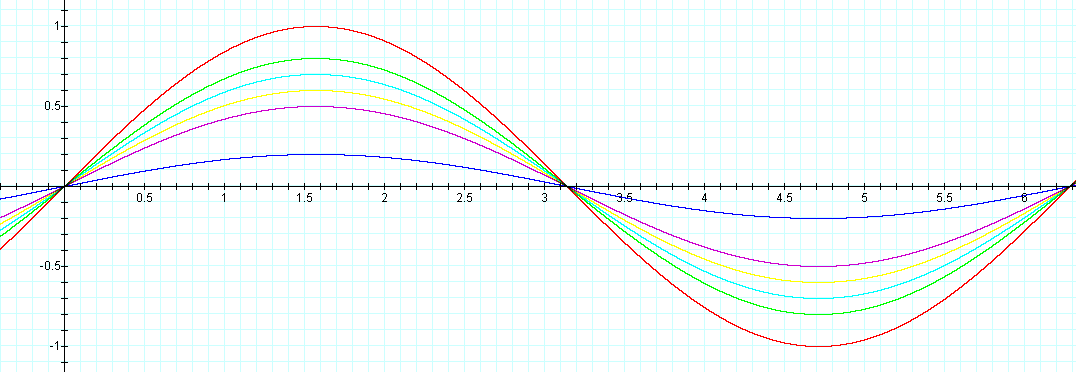
The same results from above except that the value of a is decreasing and the graph doesn't stretch outward
but is squeezed inward.
When a is negative? (a = 1 is in red, a = -1 purple, a = -2 aqua, a = -0.5 yellow)
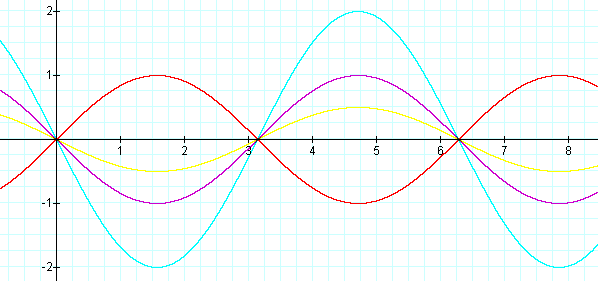
Notice the graphs are reflections of the parent graph y = sin x over the x-axis and 'stretched' according the value
of a. Also, the x-intercepts (or
zeros) are the same for the graphs. The zeros are n*(pi) where n is any
integer. Starting at the origin, the negative value of a forces the graph to go down first.
The absolute value of a is called the amplitude
of the graph.
The Constants h, k
For this exploration, a and b will equal 1. Also, k will equal 0 so that we can focus on h. To make things easier with some calculations, h will equal some constant multiplied by pi.
As h increases, what happens to
the graph? (h = 0 in red, h = 0.5 purple, h = 1 blue)
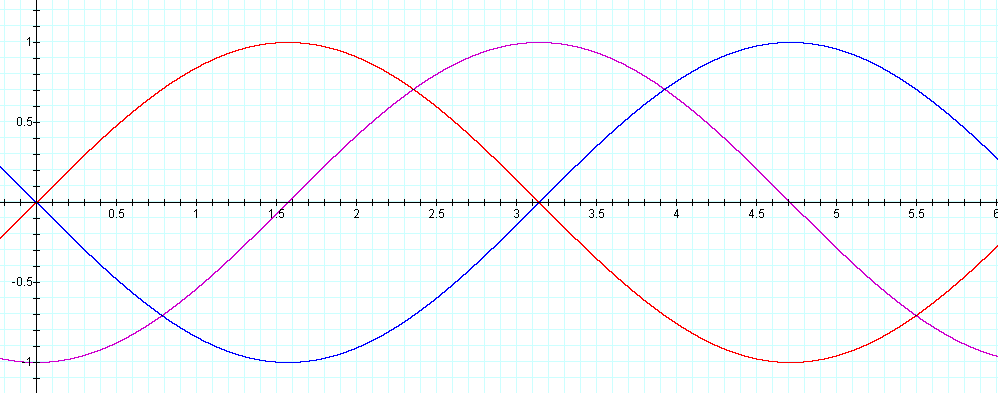
As h decreases? (h = 0 in red, h = -0.25 purple, h = -0.75 blue)
Conclusions: The graphs appear to translate right with a larger h and translate left with a smaller h.
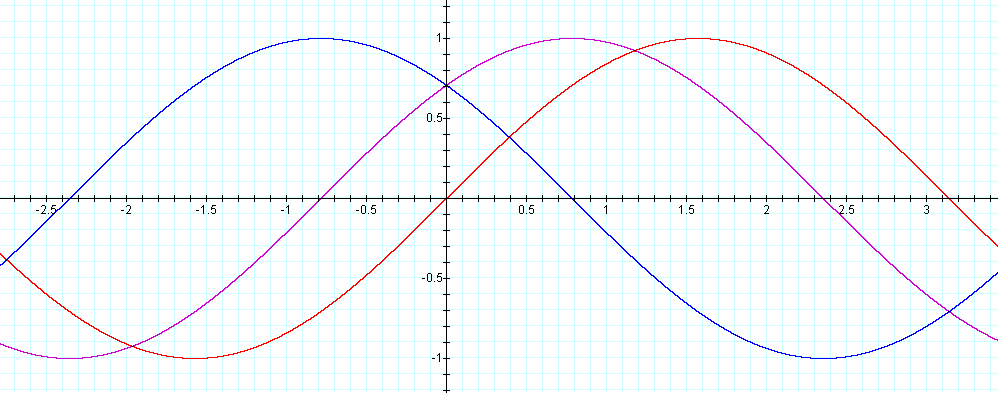
Now let h = 0 and let's
investigate k.
Here are graphs with a =1, b =1,
and h = 0. k = 0 is in red, k = 1 purple, k = -0.5 blue.
Conclusions: The graphs appear to translate up with a positive value for k and down with a negative value of k. Along with the transition, the y-intercepts for the
curves are the k values.
The Constant b
For this exploration, a will equal 1 and
h, k will equal 0.
As b increases, what happens to
the graph? (b = 1 in red, b = 2 purple, b = 3 blue)
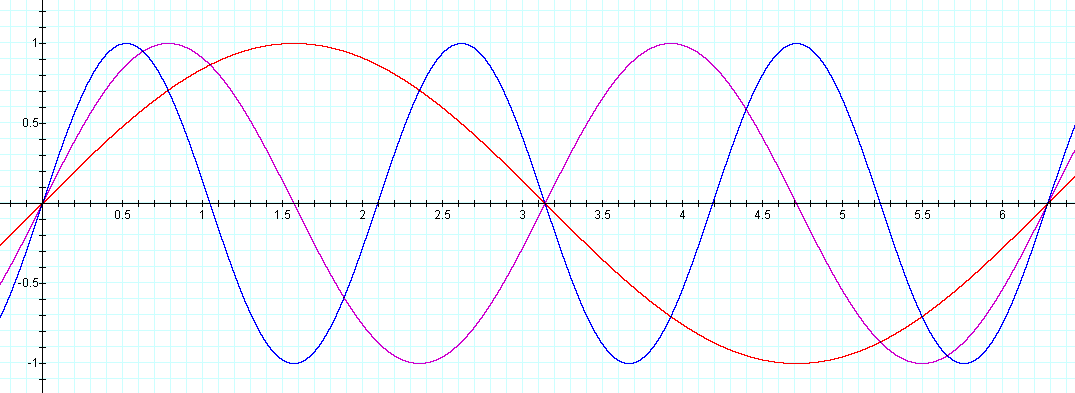
Comparing the graphs to the parent graph (red), the graphs looked compressed
(as if a force was pushing in on a spring). Also, the purple graph completes 2
complete cycles from 0 to 2 pi and the blue graph completes 3 cycles. Comparing
the period of the graphs, the period of the red graph is 2 pi, the period of
the purple graphs is pi, and the period of the blue graph is 2 pi / 3.
A b decreases? (b = 1 in red, b = 0.5 purple, b = 0.25 blue)
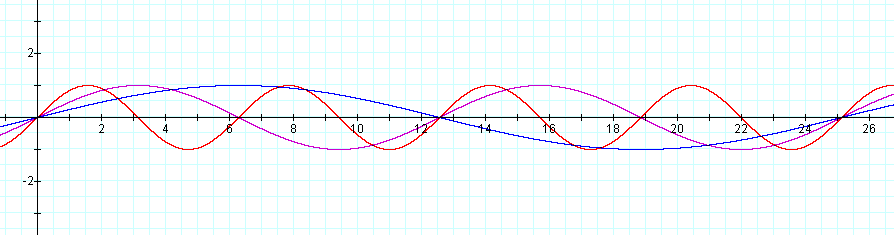
As b becomes smaller, the graphs are
pulled outward (like an over stretched spring). The purple graph completes one
cycle from 0 to 12 pi, which is twice as long as the parent. The blue graph
completes one cycle from 0 to 8 pi, which is 4 times as long as the parent
graph.
b remains positive or the graph will
reflect across the x-axis because of the opposites theorem: sin (-x)
= -sin (x).
Summary
The absolute value of a represents the amplitude (the vertical stretch).
The period represents 2 pi / (the absolute value of b).
h represents
the horizontal shift (or phase shift). The phase shift terminology represents
how much the graph is shifted right or left from its original position.
k represents
the vertical shift.