Parametric Curve
Exploration
by
A parametric curve in the plane is a pair of functions
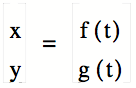
where the two continuous functions define ordered pairs (x, y).
The two equations are usually called the parametric equations of a curve. The
extent of the curve will depend on the range of t and your work with parametric
equations should pay close attention the range of t . In many applications, x and y "vary with time t
"or an angle of rotation that some line makes from an initial location. This definition is from Dr. Wilson at
UGA.
For this exploration, we are going to vary values of a and b in
the following parametric equation (where t is between 0 and 2 * pi):
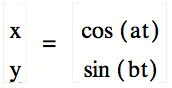
Here is a graph when a and b are both 1:
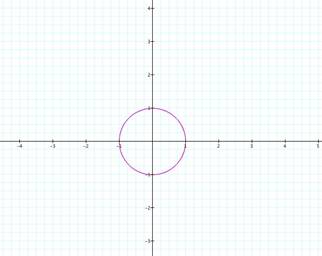
The orientation is important. Remember that cos(0) = 1 and sin(0) =0 and that any point in
the plane can be written (cos x, sin x), then the circle starts at (1,0) and
moves in a counterclockwise direction. In fact as long as a=b, then the
resulting figure will be an arc of a circle or a circle. As long as a and b are larger than 1
(and still equal), then a circle will result since t is between o and 2 *
pi. If a and bare values between 0
and 1 (and still equal), then an arc will result since the path would be some
portion of 360 degrees. Again, if
a and b are still equal and larger than 1, then the path would make more than 1
rotation. If the value for a and b are negative, then the path would travel
clockwise.
Here is a movie to try to convince you: Click here. (Here a and b values are equal and run
between 0 and 10).
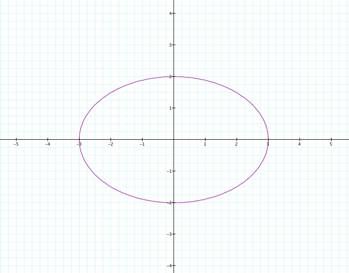
Look at the graphs below:
![]()
![]()
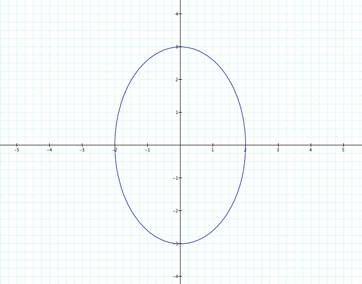
The above examples are ellipses. The pink graph has foci on the x-axis. The blue graph has foci on they-axis
because the larger number in front of cos t or sin t. Also notice that the ellipse is stretched to the number in
front of cos t along the x-axis and the number in front of sin t along
they-axis. Interesting?
Back to the assignment, lets look at 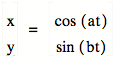 for various values of a and b, were they
are not equal.
for various values of a and b, were they
are not equal.
Here is a movie of the parametric equations above with b =1 and a
varies between -10 and 10 in 100 steps.
Click here.
Let us look at the graph when a=0.
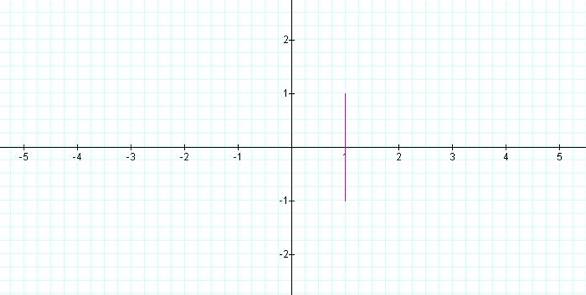
Since sine alternates between -1 and 1 and cos (0) = 1, the graph
results in a vertical line segment at x=1. (Sine is the y-coordinate.)
Here is a movie of the parametric equations with a=1 and b varies
between -10 and 10 in 100 steps. Click here.
Similar to above, here is the graph when b=0.
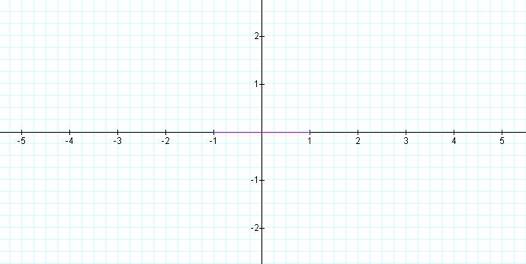
Look closely and you can see another line segment from (-1, 0) to
(1, 0) since cosine alternates between -1 and 1 and sin (0) = 1. (Cosine is the x-coordinate.)
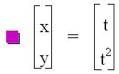
In conclusion, any equation can be separated into parametric
equations by letting x equal a variable, usually t, and solving for y in terms
of that variable. For example, the
parabola y = x2 can be written as
follows:
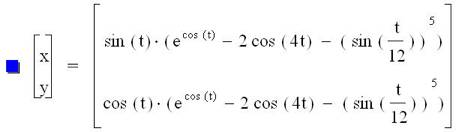
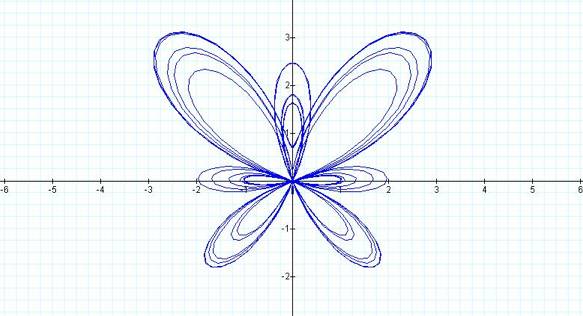
Parametric equations can results in many “neat” graphs. For example here is the butterfly curve
discovered by