
Polar Equation Exploration
by
In a rectangular
coordinate system, every point in the plane can be identified by a unique
ordered pair (x, y) representing the point’s distances and direction from two
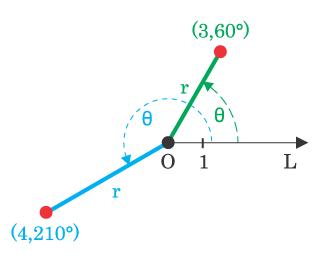
perpendicular axes. In a polar coordinate
system, a pair of numbers [r, θ] represent a unique
point. Here r or –r is the
distance, but θ is the magnitude of rotation measured in degrees or radians.
Recall that x = a forms
a vertical line (where a
is a constant) and y = b forms
a horizontal line (where b is a
constant). What would r = a form? Θ
= b?
Below are the graphs of θ = - pi / 3 (in blue) and r=3 (in red).
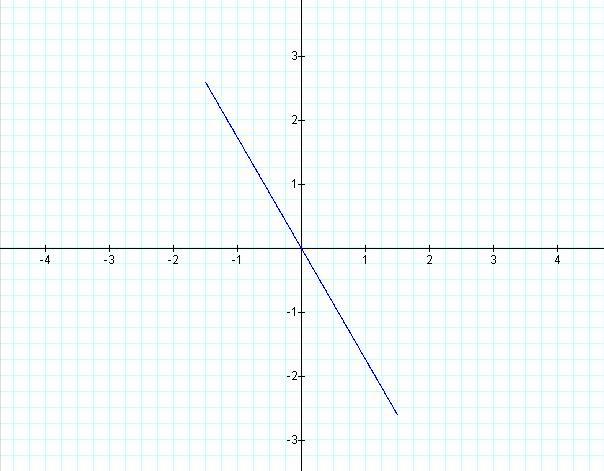
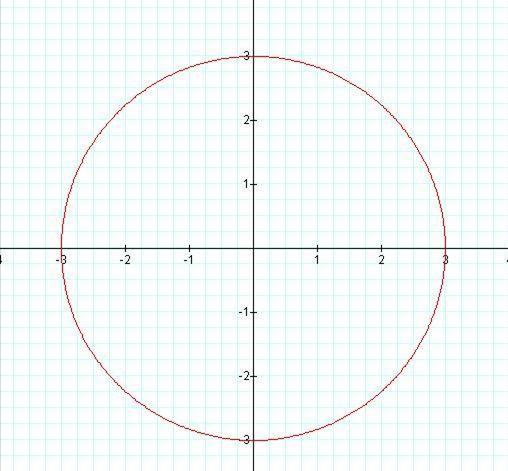
Results: r = a forms a circle centered at the
origin with radius a and
Θ = b is a line where b is the angle formed between the
positive x-axis and the line in a counter-clockwise direction.
What about r = a sin θ and r = a cos
θ? First we’ll let a=1 and remind
you of some things below.
![]()
|
θ (in degrees) |
0 |
30 |
45 |
60 |
90 |
120 |
135 |
150 |
180 |
|
r |
1 |
0.866 |
0.707 |
0.5 |
0 |
-0.5 |
-0.707 |
-0.866 |
-1 |

Graphing the points in the table for r = cos
θ:
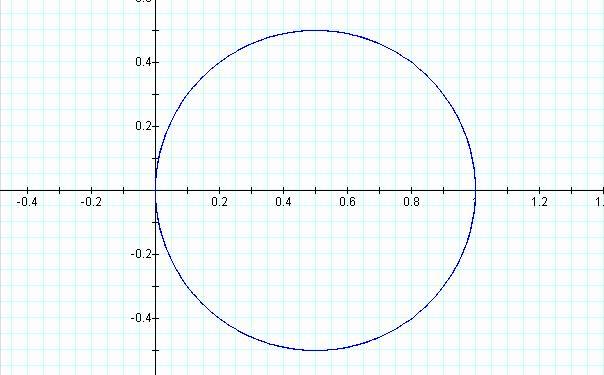
The results are a circle centered at (o.5, 0) with radius length
0.5; since a = 1 then the diameter is between (0, 0) and (1, 0).
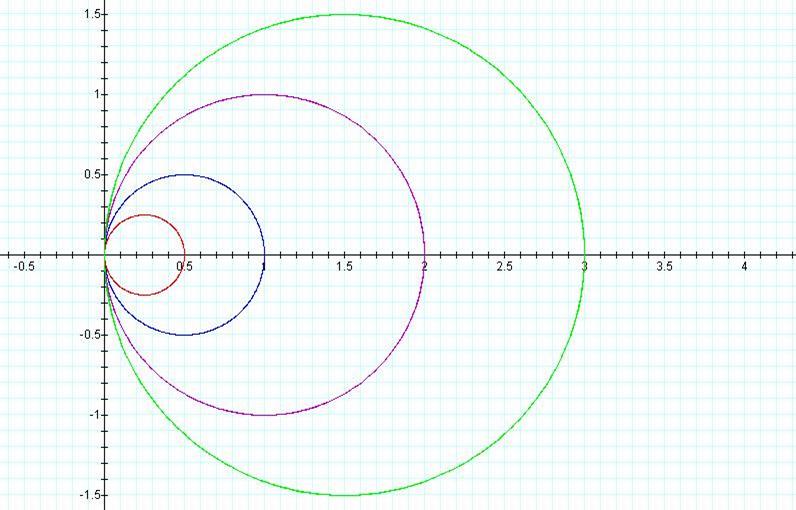
The graph below is r = a cos θ for a =
0.5 (red), 1 (blue), 2 (purple), and 3 (green).
What about r = a sin θ?
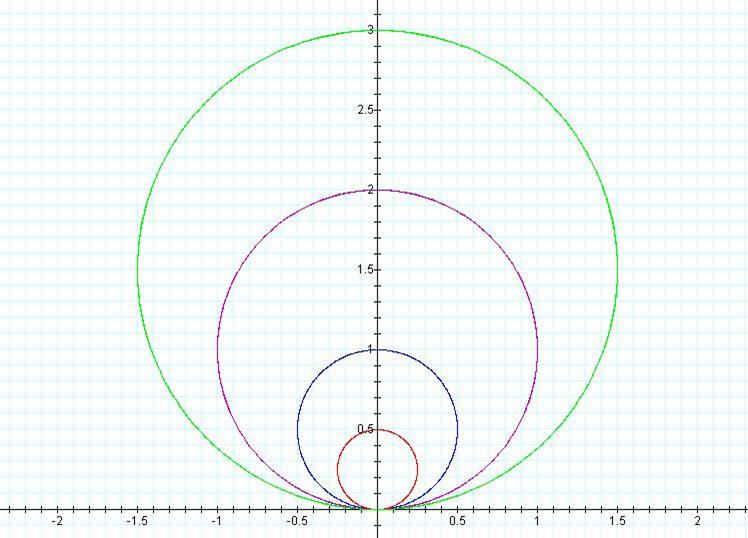
Conclusions: The
center (0, a/2) for r = sin θ is on the y-axis with a diameter between (0, 0)
and (0, a).
Rose Curves:
Recall that y = cos bθ,
where b is a positive integer, are sine waves with amplitude 1 and period 2 pi
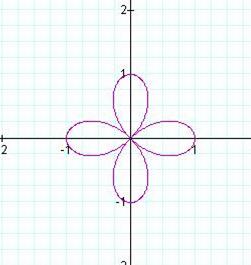
/ b. What about the graphs of polar
equations in the form r = cos bθ?
Below are graphs for b = 2, 3, and 4.
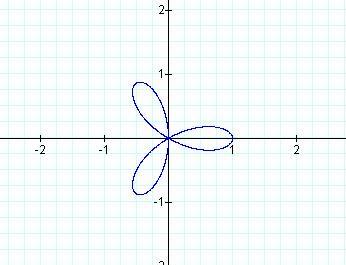
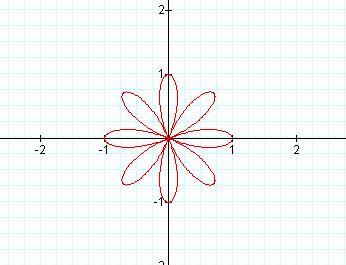
Below are the graphs of r = sin bθ for b
=2, 3, and 4.
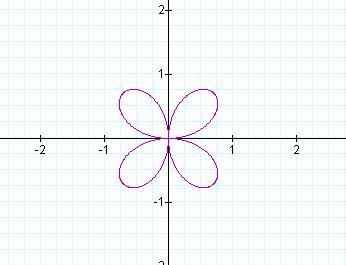
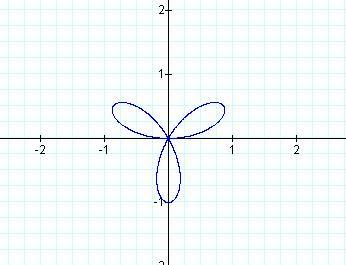
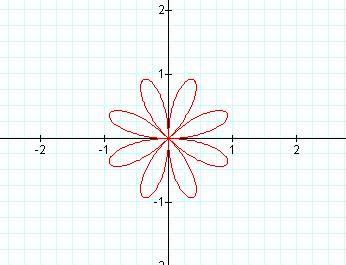
These graphs are part of a family of polar graphs called rose
curves or petal curves.
Archimedean Spiral
![]()
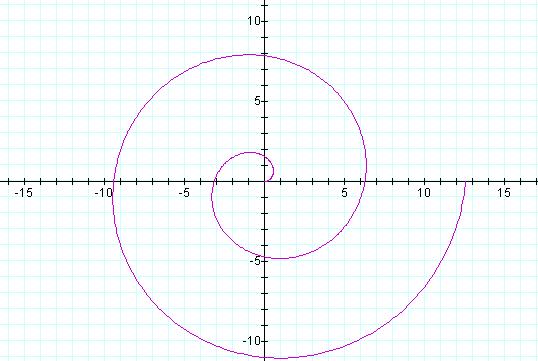
The graph above is for
θ between 0 and 4 pi.
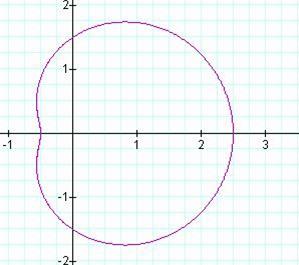
Limaçons of Pascal
Dimpled Limaçon
![]()
Limaçon with an inner loop
![]()
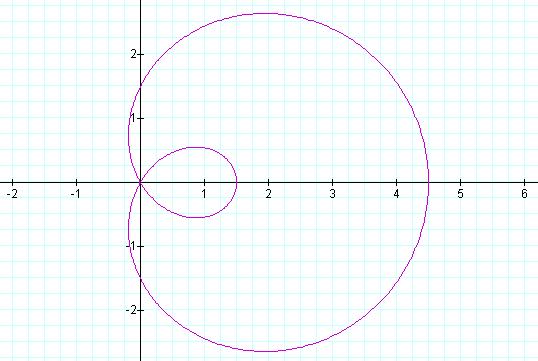
For the graph above, a
=1.5 and b = 3. Generally, to get
the inner loop, b>a where a and b are positive
values.
Cardioid (a limaçon with a cusp)
![]()
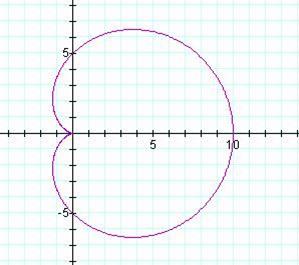
The graph above is for
a = 5 and θ between 0 and 2 pi.
Cissoid of Diocles
![]()
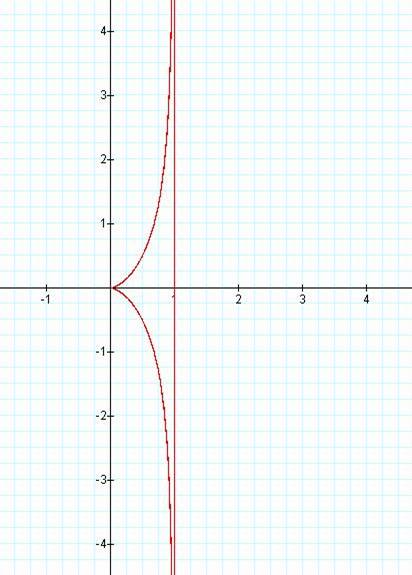
a=1, θ is between 0
and 2 pi
Folium of Descartes
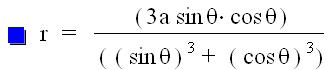
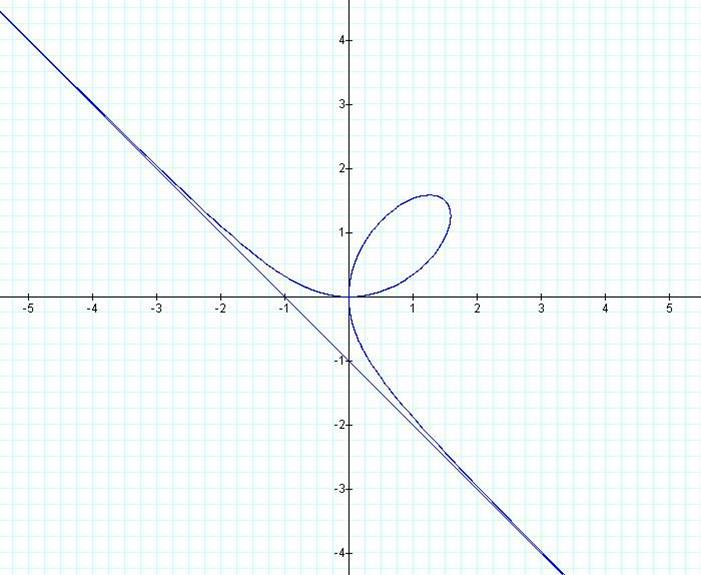
a=1, θ is between 0
and 2 pi
These are just a few famous polar graphs. Patterns could be discovered by exploring
different values of a (or b) in the above graphs. Other graphs that we could possibly
explore are the cochleoid, strophoid,
lemniscate, lituus, and
many more.