
Exploration of Quadratic
(as a varies)
by
Chad Crumley
This exploration is about the graphs of
quadratic equations of the form ![]() .
.
For this exploration, we are going to fix 2
of the values in the quadratic (a,
b, c) and see what conclusions can be found.
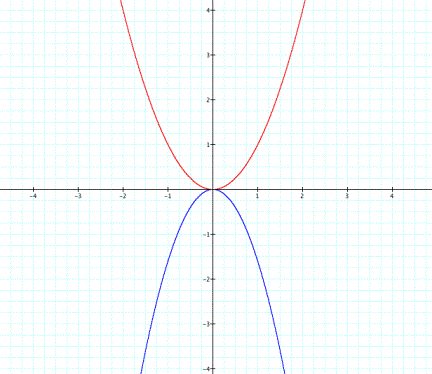
Before we begin, let's look at the parent
graph ![]() .
.
The Constant a
For this exploration n = a.
![]()
![]()
To see a movie
as n varies, click here.
After watching
the movie, what are your conclusions?
First for
positive n: As n increases, the graph will increase at a faster rate
than the parent graph. Thus, the
graph gets closer to the y-axis (or the graph appears thinner.) As n decreases, the graph will decrease at a slower rate
than the parent graph. Thus, the
graph gets further away from the y-axis (or the graph appears wider.)
For negative n: As n decreases (obtaining a larger absolute value), the
graph again moves closer to the y-axis becoming thinner. As n increases (obtaining a smaller absolute value), the
graph moves away from the y-axis becoming wider.
What about when n = 0?
Then the equation becomes y
= 0 (a constant function). In
other words, no quadratic is produced.
Now lets fix b and c
and vary a in the equation ![]() .
.
For this
exploration b = 1, c = 2, and
a = 1 (red), a = 2 (blue), a = -1
(purple), a = -2 (green), a = -3 (aqua), a = 3 (yellow), a = 5
(grey), a = -5 (black), a = 6 (purple), a = -10 (blue).
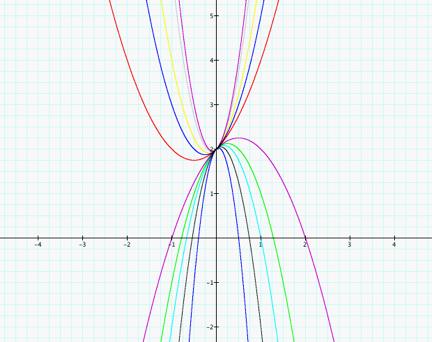
The vertices of
the graphs above appear to be slightly moving and it appears there is a slant
asymptote that the graph is approaching.
Look at this
movie. Click here.
After
looking at the movie, what is the equation of the slant asymptote?
Here
again is the graph:
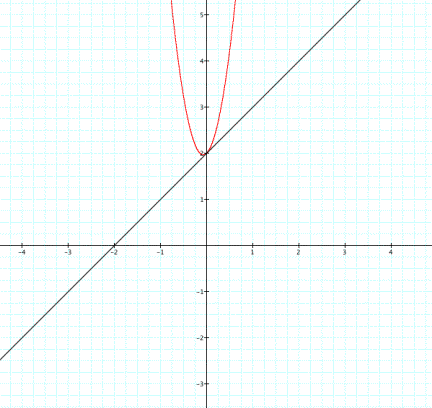
So,
the line has slope of 1 and y-intercept of 2. So the asymptote is the linear equation:
![]()
Or,
this equation is the same as the quadratic equation:
![]()
with
n = 0.