
For assignment #1 I have chosen to analyze the function x^n + y^n = 1 for both odd and even values of n.
I began by plotting the recommended functions laid out in the problem.
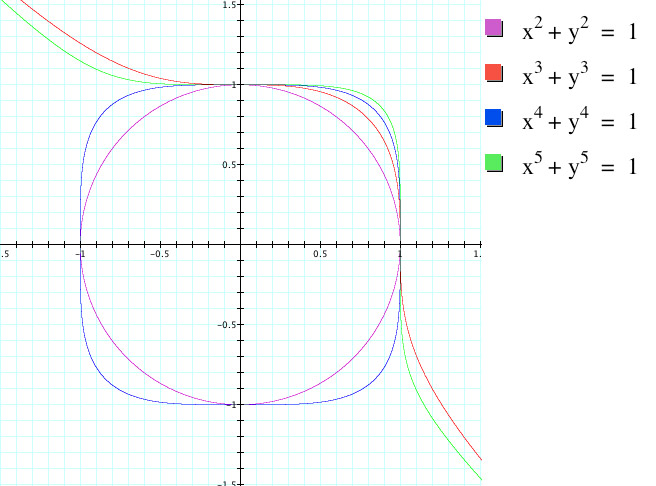
From this graph, we can see visually that the red and the green functions have different properties than the blue and purple functions. Upon a cursory inspection, we can see that the red and green functions are those with odd (3 and 5) exponents and the blue and purple funcions are those with even (2 and 4) exponents. This may lead us to believe that there will be a difference between all odd and even iterations of this function. In order to further investigate this idea, let's plot a graph where n is always even:
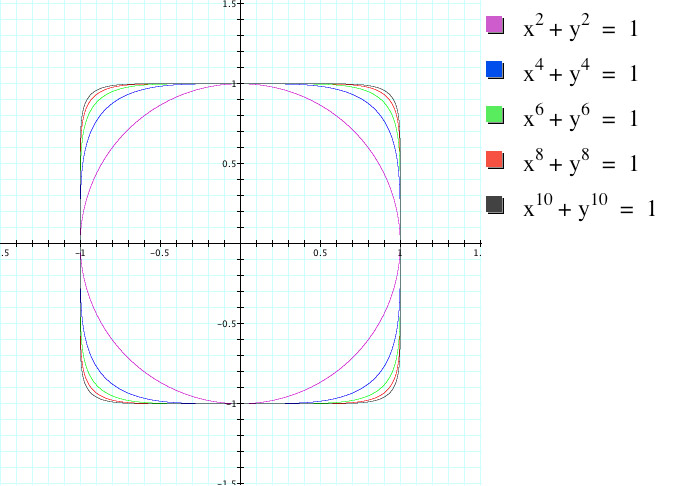
As we can see, when the value of n=2, we have a circle. Then, as the value of n increases we can see that the circle begins to gain straight sides that are parallel to the x and y axis. As n continues to increase, the length of the straight segements increase and rounded corners begin to form. Plotting only fixed values of n can only tell us so much. Let us continue to investigate this even function by creating an animation of x^n + y^n = 1 for values of n from 2 to 24:
We can now see that as n increases, the shape of the circle will begin to converge towards that of a square. The corners will still be round but we can make them increasingly "sharp" by increasing n. If we are to make a conjecture towards the shape of x^24 + y^24 = 1 as the problem asks, we should now easily be able to make an educated guess. We should be able to see that when n = 24, the shape of the graph will be most similar to the animation above at it's most extreme case. Therefore it should look somewhat like a square. We can test our guess by simply graphing the equation.
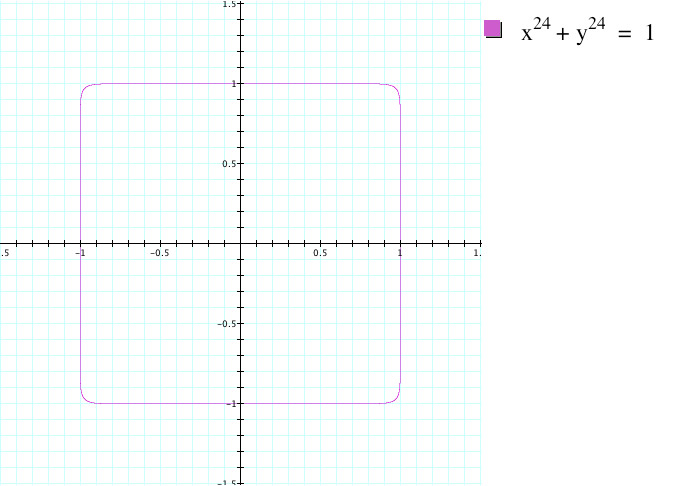
We can see that our hypothesis was correct. While this graph does still have some rounded corners, we should now be able to know that if we were to increase our n, these rounded corners would "sharpen" out.
Let's now begin looking at the equation when the values of n are odd. We will begin the same was as we did with the even values of n, by graphing a few examples and seeing if we can find a pattern:
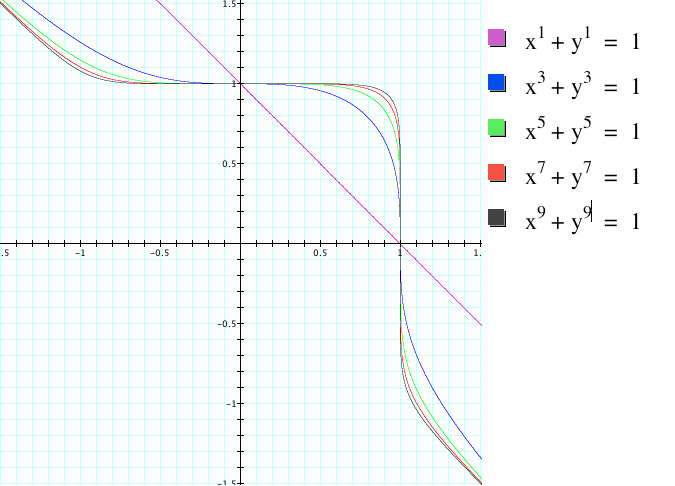
We can see from the example graphs that this will somewhat resemble the graphs we had in our odd values of n. However, in this example, we only have 1 rounded corner. In addition, this corner has "tails", or lines that come off of it and go off. In order to better understand how this graph will change with larger values of n, lets look at the odd values of n from 1-25:
As we saw with even values of n, as n increases our corner will continue to sharpen. However, the main difference in this equation is the tails. As the value of n increases, we can see that the tails will converge towards taking the shape of y = -x, but only when |x| and |y| > 1. Now that we have been able to notice these patterns, making a conjecture to the shape of x^25 + y^25 = 1 should be an easy task. It will take the shape of a single sharp corner whose tails are equal to y = -x. Let's graph this equation to see if we are right:
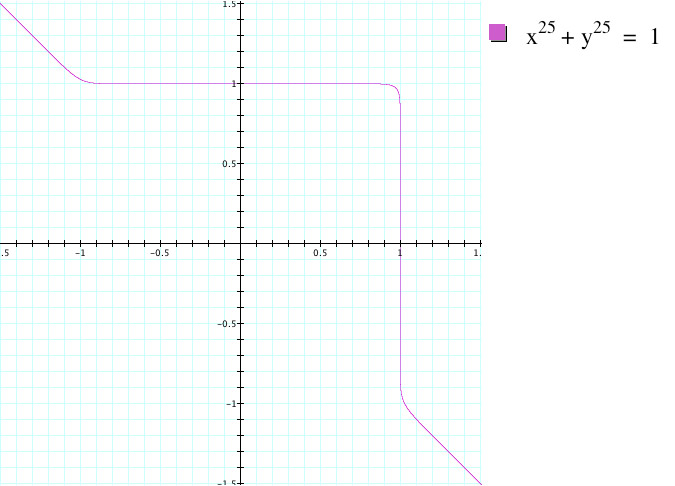
We are correct! Again the corner is still somewhat rounded, but that could be sharpened by increasing our value of n. By analyzing these two types of equations we have been able to determine patterns of the sum of two variables of equal degree that equal 1.